Previous Issues Volume 1, Issue 1 - 2017
Comparison of Two Cardiac Output Monitors, qCO and LiDCO, During General Anesthesia
J Escriva Munoz1,E Gabarron2, P Fort1,Y Pan3,Shengjin Ge3,Q Liao3,M Vallverdu1
1Biomedical Engineering Research Centre, Universitat Politècnica de Catalunya, CIBER of Bioengineering, Biomaterials and Nanomedicine (CIBER-BBN), Barcelona, Spain.
2SPEC-M Lab of the Dept. Anesthesiology, Hospital Clínic, Univ. Barcelona, Barcelona, Spain.
3Zhongshan Hospital, Shanghai, China.
Corresponding Author:Escrivá Muñoz J, Biomedical Engineering Research Centre, Universitat Politècnica de Catalunya, CIBER of Bioengineering, Biomaterials and Nanomedicine (CIBER-BBN), Barcelona, Spain, Tel: +34 649110370; E-Mail: [email protected]
Received Date: 15 Jun 2016 Accepted Date: 18 Jul 2016 Published Date: 09 Aug 2016
Copyright © 2016 Escrivá Muñozj
Citation:Escrivá Muñoz J, Gabarrón E, Fort P, Pan Y, et al. (2016). Comparison of Two Cardiac Output Monitors, qCO and LiDCO, During General Anesthesia.Mathews J Anesth. 1(1): 002.
ABSTRACT
Background: Optimization of cardiac output (CO) has been evidenced to reduce postoperative complications and to expedite the recovery. Likewise, CO and other dynamic cardiac parameters can describe the systemic blood flow and tissue oxygenation state and can be useful in different clinical fields. This study aimed to validate the qCO monitor (Quantium Medical, Barcelona, Spain), a new device to estimate CO and other related parameters in a continuous, fully non-invasive way using advanced digital signal processing of impedance cardiography.
METHODS:
The LiDCOrapidv2 (LiDCO Ltd, London, UK) was used to compare the performance of the qCO in 15 patients during major surgery under general anesthesia. Full surgeries were recorded and cardiac output obtained by both devices was compared by using correlation and Bland-Altman analysis.
RESULTS:
The Bland-Altman analysis showed sufficient agreement with a mean bias of -0.03 ±0.71 L/min. Conclusions: The findings showed that both systems offered comparable values and thus the non-invasive measurement of CO with qCO is a promising, feasible method. Further investigation will be required to validate this new device against calibrated devices and outcome studies would also be highly recommended.
KEYWORDS:
Cardiac Output; Non-Invasive Hemodynamic Monitoring; qCO; LiDCO; Impedance Cardiography; Prediction Probability.
DISCLOSURE:
This study was funded within the Industrial PhD program by the Regional Catalan Government (DI-2014, Generalitat de Catalunya, Spain).
INTRODUCTION:
Since Adolph Fick in 1870 described the first method to estimate cardiac output (CO), its measurement is considered an important tool due to the fact that a great percentage of disorders are related to systemic hemodynamics [1]. However, measuring CO is often omitted because of the complexity and risks involved in the invasive methods such as the Swan-Ganz catheter [2, 3]. Regardless, thanks to the development of new minimally- and non-invasive techniques, CO monitoring has been increasing during the last two decades. The classical thoracic bioimpedance cardiography is based on the fact that the fluids on the thoracic compartment alters the body resistance to the electrical current [4]. Therefore, variations derived from the cardiac cycle of the blood volume flow in the aorta are related to changes in impedance measurement. This impedance wave is recorded using 4 electrodes by applying a high-frequency current with a given amplitude and frequency; its first derivative (dZ/dt) is used to compute the stroke volume (SV) [5]. Some of the new technologies which have lately been developed are modifications to the classical thoracic bioimpedance measurement. The thoracic bioreactance technique detects phase shift changes in voltage, which depend on pulsatile flow [6, 7]. Electrical velocimetry uses the same principles of bioimpedance, but applying a modified equation based on the maximum rate of change of the impedance [8, 9]. Electrical bioimpedance using endotracheal electrodes is supposed to provide an improved signal (with reduced noise) although due to the proximity to the aorta placement, the system requires an arterial catheter and hence it is not a fully non-invasive method [10, 11]. Monitoring of stroke volume is useful in preventing hypo- and hyperperfusion during the so-called GoalDirected Therapy (GDT) [12]. This therapy determines the need for volume resuscitation and the fluid responsiveness. Other examples of possible clinical applications are the diagnosis and prognosis of disorders such as the cardiogenic, hypovolemic or septic shock, guiding cardiac drugs administration and preventing complications after surgery [13, 14]. Scientific evidence supports the correlation of advanced monitoring with a good tissue perfusion and better hemodynamic optimization. This improves patient outcome, reduces mortality rates and hospital costs. Therefore, continuous cardiac parameters are especially useful in some medical specialties such as anesthesiology, emergency care and cardiology [11- 15]. The qCO monitor analyses the thoracic impedance and uses advanced digital signal processing for estimating the SV and CO. This technology offers high reliability in rejecting artefacts for better reproducibility and accuracy compared to former impedance cardiography (ICG) techniques. The aim of this study was to test the performance of the qCO using the LiDCOrapid as a reference. The two devices can monitor the CO continuously, but with different methods. The qCO detects variations in the impedance, while LiDCOrapid processes the pressure waveform to estimate the CO [16]. Several studies report an improved outcome with the usage of LiDCOrapid to guide goal-directed fluid therapy after emergency laparotomy a reduced length of hospital stay in colorectal surgery and in high-risk abdominal and bariatric surgery [17-19]. Therefore, the aim of this study was to compare the behaviours of LiDCOrapid and the new qCO device during anaesthesia procedures in the operatory room.
MATERIALS AND METHODS
Study Protocol Fifteen patients undergoing major surgery under general anesthesia at the Zhongshan Hospital in Shanghai were assessed in this observational study. Details of the patients and operations are reported in Table 1. Age ranged between 43 and 67 years, with a mean age of 58.9 ± 6.7 years and a mean body mass index of 22.8 ± 2.6 kg/mm². Anesthesia was induced with a target-controlled infusion system (TCI). The infusion rate of remifentanil was controlled by Minto’s pharmacokinetic model with 4 ng/ml as effect-site target concentration and the infusion rate of propofol was controlled by Schnider’s pharmacokinetic model with 3 µg/ ml as effect-site target concentration [20, 21]. Rocuronium, a short-to-intermediate-term muscle relaxant, was administered before intubation. The rocuronium loading dose was 40 mg. Anesthesia was maintained with sevoflurane, remifentanil and boluses of fentanyl administered in doses of 50 or 100 µg as needed. Additional maintenance doses of rocuronium were used in the form of 10 mg boluses. In some cases lidocaine, morphine, atropine or ephedrine were additionally administered. The surface electrodes (Ambu® BlueSensor for ECG) were used for the qCO monitor. The pressure waveform for LiDCOrapid was obtained with an arterial line. The recordings were assessed simultaneously during the complete procedure, from 3 minutes before induction of anesthesia to 3 minutes after the recovery. This observational study was conducted in compliance with the requirements of the Zhongshan Hospital Ethical Committee. Exclusion criteria were patients under eighteen years old and pregnant women. Different types of surgery were included in our study since the objective was the direct comparison between both monitors.
Table 1:Patient characteristics. Age, Height, Weight and BMI are given as mean ± standard deviation.
| Sex (m:f) Age (years) Height (m) Weight (kg) BMI (kg m-2) Operative procedure | 9:6 58.9 ± 6.7 163.7 ± 6.8 61.1 ± 9.1 22.8 ± 2.6 No. of patients |
| Mastectomy Carotid endarterectomy Cytoreductive surgery Gastrostomy Hepatectomy Nephrectomy Ovarian cystectomy Thyreoidectomy lithotripsy lithotripsy Uretescope Hysteroscopic Resection (TCRF) | 1 1 1 2 2 1 1 1 4 1 |
CARDIAC OUTPUT CALCULATION The qCO records the impedance cardiography (ICG) and electrocardiogram (ECG) by using 4 electrodes, with one pair injecting a constant current (400 μA RMS at 50 kHz), and a second pair of electrodes measuring the resulting voltage (Figure 1). The voltage is amplified and digitized with a sampling frequency of 1,000 Hz. The qCO monitor uses the information from the impedance curve (Z) to calculate different hemodynamic variables.
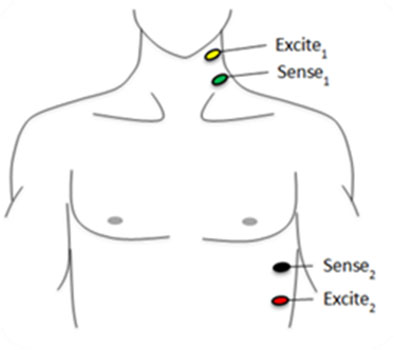
Figure 1:Location of the qCO electrodes [22].
The ICG signal represents the changes of the thoracic impedance due to variations in the blood flow. In practice, the raw Z signal is transformed into the –dZ/dt waveform by using the first derivative to remark the inflection points of the raw Z signal. This signal is post-processed to increase its quality as shown in Figure 2.
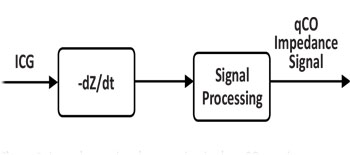
Figure 2:Impedance signal processing in the qCO monitor.
The most important characteristic points of the qCO impedance signal are their maxima (C) and their preceding minima (B), as observed in Figure 3. These points are associated to distinct physiological events within the systolic part of the cardiac cycle: B points are the downward deflection due to the contraction of the atria and C points are the major upward deflection occurring during systole [23]. In that sense, the R wave from the ECG signal is an important reference for detecting such events. The qCO algorithm locates these points, which relate to the stroke volume of the patient. The main problems arising from these point locations involve noise detection and movement of the patient, since the signals are highly sensitive. Different algorithms to prevent noise and artifacts are implemented in the qCO device. The ECG waveform reflects the changes in the electrical activity derived from the myocardium depolarizing and repolarizing during the cardiac cycle. This signal is used to calculate the heart rate (HR) and R-R interval (consecutive time between R waves which represent the ventricular depolarization). The mentioned waveforms are depicted in Figure 3.
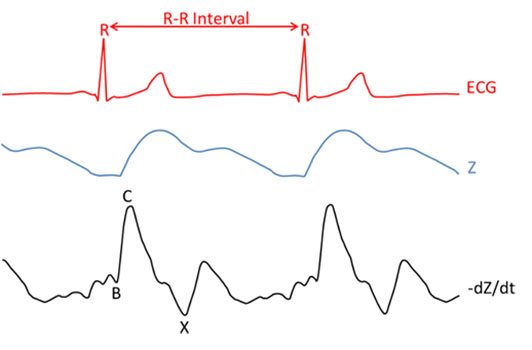
Figure 3:Time relationship between the ECG, Z and -dZ/dt waveforms. The characteristic point of the -dZ/dt waveform is identified as B, which corresponds to the opening time of the aortic valve (identified as the local minima before the C point). The C is the maximum blood flow in the left ventricle. The X reveals the closing of aortic valve (identified as local minima after C point).
DATA PREPARATION
The synchronization between both devices was ensured by annotating the exact start time given by the two devices. Data values of cardiac output were not taken into consideration when there was an instantaneous variation of either HR, CO or SV greater than 25% which was not justified from a clinical point of view. This led to a total rejection rate of < 2% for LiDCOrapid and < 1% for qCO. Two patients (one for gastrostomy and another one for cytoreductive surgery) were excluded due to excessive noise, and thus a total of thirteen patients remained to be considered for this study. To create the pairs of cardiac output values, each CO point from qCO was paired with the closest CO point by LiDCOrapid within a time difference of one second between both points.
STATISTICAL ANALYSIS
The qCO agreement with the LiDCOrapid’s signal was assessed using different statistical techniques: correlation and BlandAltman analysis. A correlation analysis was conducted to estimate the relationship between the cardiac outputs calculated by the LiDCOrapid and qCO monitors. Correlation can show whether pairs of variables are related but a high correlation does not imply a good agreement between two methods. Bland-Altman analysis for repeated measurements per patient were used for the pool of patients to assess the agreement between qCO and LiDCOrapid. The Bland-Altman plot, also known as difference plot, is a method to compare two techniques (usually one of them as a reference) for the measurement of the same parameter. The correlation is shown by plotting the differences between the measurements produced by both methods against the mean value of such measurements. A linear mixed model with random effects was used to adjust for the interaction between the two methods and the time replicates of patients, resulting in a common standard deviation (SD) to calculate the limits of agreement (LOA) with its upper and lower limits determined by the mean difference between data from the reference and studied method ± 1.96 SD [24-26]. The percentage error was calculated as the ratio of 2SD of the bias to the mean CO and was considered clinically acceptable when it was 30% or less, as proposed by Critchley and Critchley [27, 28]. Before computing the Bland-Altman plot, according to Squara et al. [29], each recording should be divided into unchanging, increasing and decreasing periods and the description of a device can only be estimated on unchanging, stable periods.
RESULTS
Data from 13 patients, 8 males and 5 females were included into final analysis. Not a single patient suffered from any complication in the context of the present study. Blood loss, fluid administration and hypotension periods after induction were not included into this analysis. Figure 4 displays one of the cases. In this figure, it is visible that qCO and LiDCOrapid share a common overall trend. However, LiDCOrapid shows several sudden drops in cardiac output for which there is no reported clinical evidence and which are not followed by the qCO monitor.
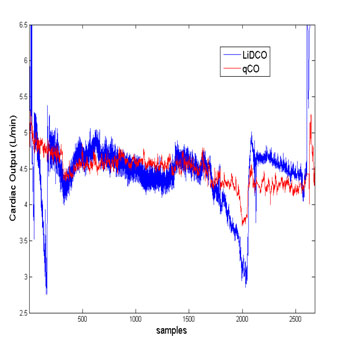
Figure 4:The cardiac output assessed by the qCO and the LiDCOrapid. The figure shows an example of a recording obtained with qCO and LiDCOrapid.
Patient hemodynamic data are reported in Table 2. According to qCO, cardiac output ranged 4.5 ±0.5 L/min, stroke volume 69.6 ± 8.8 mL/beat. According to LiDCOrapid, these values were 4.5 ± 0.7 L/min and 69.8 ± 10.9 mL/beat. Heart rate was the same for both devices: 64.8 ± 7.5 bpm. Non-significant differences were observed between qCO and LiDCOrapid regarding those values.
Table 2:Hemodynamic characteristics. All values are presented as mean ± standard deviation.
| Surgery duration (min) | 135.1 ± 59.63 |
| Cardiac Output (L/min) | 4.5 ± 0.5 (qCO); 4.5 ±0.7 (LiDCOrapid) |
| Stroke Volume (mL/beat) | 69.6 ± 8.8 (qCO); 69.8 ± 10.9 (LiDCOrapid) |
| Heart Rate (bpm) | 64.8 ± 7.5 (qCO and LiDCOrapid) |
The operative procedures, whose type is also reported in Table 2, lasted 113 [88 200] minutes (median and 25, 75-percentiles). A median of 3,557 [2,407 6,996] points (median and 25, 75-percentiles) were paired from qCO and LiDCO cardiac output. Correlation analysis showed no good indication of proportional bias (r2 =0.3987, p < 0.05). This analysis and the BlandAltman plot are included in Figure 5 and Figure 6, respectively. The Bland-Altman plot compares the differences in CO values against the mean of the total measures of both methods, qCO and LiDCOrapid. In Figure 6, the black solid line represents the mean difference and the dotted lines represent the accepted limits of agreement (mean difference ± 2SD). The standard deviation has been corrected for the pooled data using two variances: that for repeated differences between the two methods on the same subject and that for the differences between the averages of the two methods across subjects.
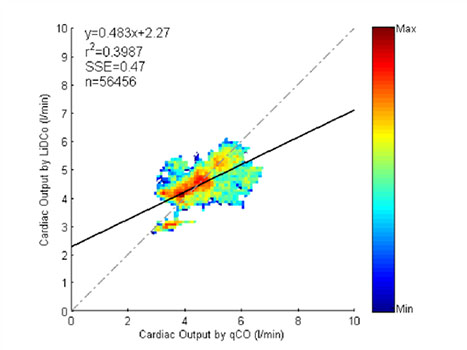
Figure 5: Correlation analysis of the pool data.
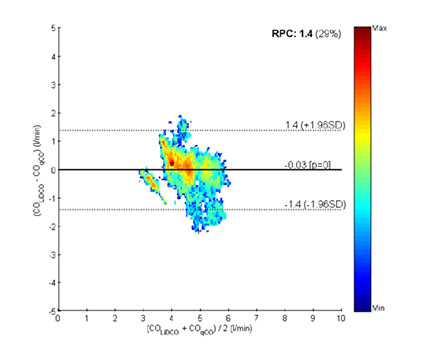
Figure 6:Bland-Altman plot of comparing the differences in CO values against the mean of the total measures of qCO and LiDCOrapid. The color column indicates the number of points in each square.
In this case, the Bland-Altman analysis shows a mean bias of -0.03±0.71L/min. Upper and lower limits of agreement are 1.4 and -1.4, respectively. Percentage error was 29%, which is just below the recommended 30% [27, 28]. The color bar ranges from a 0 to 1043 in logarithmic units, so the areas outside the limits of agreement are not relevant compared to the rest of the figure.
DISCUSSION
This study reports an initial validation of the new qCO device against the LiDCOrapid device with a mean bias of -0.03 ±0.71 L/min. There is a reasonable amount of studies on the LiDCOrapid technology. In a study by Phan and colleagues, LiDCOrapid showed an increase of 41% after a fluid bolus measurement [30].When comparing the test device to thermodilution, the kappa statistic showed fair agreement of 0.28. After vasopressor administration, there was also significant variation in the change in cardiac output. Using Bland-Altman analysis, the precision of LiDCOrapid in comparison to thermodilution showed minimal bias, but wide limits of agreement with percentage errors of 54.2%. In this study, other instruments were also tested against thermodilution with similar results. These findings indicated that LiDCOrapid, Vigileo Flotrac and Oesophageal Doppler Monitor (ODM) differ in their responses, do not always provide the same information as thermodilution and should not be used interchangeably to track cardiac output changes. Nordström and colleagues compared ODM and LiDCOrapid for stroke volume (SV) optimization during colorectal surgery using fluid challenges [31]. For 172 paired SV values, the overall correlation was r=0.39, and bias (limits of agreement) -28 [-91 35] mL, percentage error 70%. The ability of LiDCOrapid to track changes in SV compared to ODM was weak with a concordance rate of 80%, and a sensitivity and specificity of 48% and 81%, respectively, to detect a positive fluid challenge. Davies and colleagues conducted a study where simultaneous reading of SV, stroke volume variation (SVV) and pulse pressure variation (PPV) from LiDCOrapid and FloTrac were taken in 20 patients and compared with ODM [32]. The main conclusion was that SV measured by the FloTrac and LiDCOrapid systems does not correlate with the ODM, has poor concordance and a clinically unacceptable percentage error. However, SVV measured by the LiDCOrapid has clinical utility. Costa and colleagues studied the level of agreement between cardiac output obtained by LiDCOrapid and continuous cardiac output (CCO) and intermittent cardiac output (ICC) obtained by the pulmonary artery catheter (PAC) in patients after liver transplantation [33]. The performance of LiDCOrapid was moderate in detecting changes in ICO. The current study statistically describes the new qCO monitor. It therefore constitutes an initial validation of this new monitor. Today, clinicians can choose amongst a wide variety of less-invasive or non-invasive devices to calculate cardiac output. Each device consists on a proprietary software algorithm which processes different types of signals. However, several studies have demonstrated a lack of accuracy in these monitors [9, 13, 27, 30-33]. Quantium Medical qCO monitors is born from the intention of applying advanced signal processing techniques to bioimpedance signals in order to offer a totally non-invasive device to measure cardiac output. Our main finding is the acceptable percentage error of the qCO monitor compared to the LiDCOrapid system. It should be mentioned that several studies have previously demonstrated the validity of monitors using a technology similar to qCO in comparison to calibrated methods. The NICOM monitor (Cheetah Medical) compared to thermodilution showed a mean bias of -0.81 with 95% limits of agreement of [3.54 +1.92] [34]. Cardiac output by NICOM was also more precise than by thermodilution (precision of 3.5 ± 0.3% for NICOM versus 9.6±6.1% for thermodilution, p < 0.001). In our study, the Bland-Altman plot between qCO and LiDCO shows that the majority of values adjusted to the agreement limits and the hot spots are distributed near zero (represented with the hottest colors in Figure 6). The mean bias is -0.03 and the limits of agreement are +1.4 and -1.4. Given the large sample size (56,456 total samples), this distribution of the points demonstrates a very low bias. In a similar study performed for the validation of electrical velocimetry (EV) with cardiac magnetic resonance imaging (CMR) as reference, the authors admitted an insufficient agreement and referred to a Bland-Altman plot with a mean bias of 1.2±1.4 L/min [35]. This represents a higher mean bias and wider limits of agreement compared to the data published in the present article. Consequently, it is possible to affirm that nearly identical results can be provided from qCO and LiDCOrapid. Our study presents a number of limitations which must be considered. First, the observational protocol included a variety of operations and did not include exact measuring points. It is especially important to note that this variety of operations can imply different requirements in fluid management. Although this introduces a higher variability in our findings, it was useful to characterize the general behavior of the qCO monitor. Nonetheless, one should recognize that this methodology might not provide sufficiently clean data to make perfect comparisons between technologies. This is also linked with the fact that segmentation into unchanged, increasing and decreasing periods was not possible. Some authors have stated that the comparison and analysis of medical devices must be conducted during stable periods [29]. However, the analysis of the trends in our recordings showed a lack of many unchanged periods and, therefore, the analysis of the bias was performed on all data and not only on the data with unchanging trend. At the same time, this implies an important limitation although it should also be noted that the purpose of this work was to compare the behavior of both instruments under the same varying conditions. As previously mentioned, LiDCOrapid is not a gold standard. Further studies against calibrated devices, such as the pulmonary artery catheter, will be required in order to complete the validation of the new qCO monitor. Moreover, in future studies, more protocolary procedures would be highly recommended. Outcome studies are also a powerful tool to take into account in order to validate the benefits of the usage of the qCO monitor. Furthermore, the implementation of more detailed protocols will also allow determination of the trending ability of changes between qCO and other standard technologies. Finally, future studies will need to include the analysis of the precision of the qCO device as reported in [36]. Precision is a major issue in clinical monitoring which has also been cited for other devices during the discussion but not analyzed for the case of the qCO.
CONCLUSIONS
In conclusion, the results suggest that cardiac output calculated with the qCO monitor is comparable to the values calculated by the LiDCOrapid monitor. In line with this and previous studies, the qCO has demonstrated a very low bias with the LiDCOrapid monitor in a variety of different situations [22, 37]. Future studies need to be performed to compare the qCO with calibrated devices in order to ensure a complete validation. Certainly, the availability and reliability of non-invasive cardiac output devices make cardiac output monitoring an attractive option for all clinical situations.
ACKNOWLEDGMENTS
This work was supported by MINECO (TEC2014-603337-R) from Spanish Government. CIBER of Bioengineering, Biomaterials and Nanomedicine is an initiative of ISCIII.
CONFLICTS OF INTEREST
This work was funded within the Industrial PhD program by the Regional Catalan Government (DI-2014, Generalitat de Catalunya, Spain) in collaboration with Quantium Medical, SL.
REFERENCES
- Fick A. (1870). Ueber die Messung des Blutquantums in den Herzventrikeln. Sitzungsber Physiol. Ges Wuerzbg. 2, 16.
- Lopez AC, Sala MF and Salgado AR. (2010). El papel del cateter de Swan-Ganz en la actualidad. Med. Intensive. 34(3), 203-14.
- Chatterjee K. (2009). The Swan-Ganz catheters: past, present, and future. A viewpoint. Circulation. 119(21), 147-152.
- Kubicek WG, Patterson RP and Witsoe DA. (1970). Impedance cardiography as a noninvasive method of monitoring cardiac function and other parameters of the cardiovascular system. Ann. NY. Acad. Sci. 170, 724-732.
- Woltjer HH, Bogaard HJ and de Vries PMJM. (1997). The technique of impedance cardiography. Eur. Heart J. 8(9), 1396-1403.
- Keren H, Burkhoff D and Squara P. (2007). Evaluation of a noninvasive continuous cardiac output monitoring system based on thoracic bioreactance. Am. J. Physiol. Heart Circ. Physiol. 293(1), 583-589.
- Squara P, Rotcajg D, Denjean D, Estagnasie P, et al. (2009). Comparison of monitoring performance of Bioreactance vs. pulse contour during lung recruitment maneuvers. Crit Care. 13(4), 125.
- Raue W, Swierzy M, Koplin G and Schwenk W. (2009). Comparison of electrical velocimetry and transthoracic thermodilution technique for cardiac output assessment in critically ill patients. Eur J Anaesthesiol. 26(12), 1067-1071.
- Heringlake M, Handke U, Hanke T, Eberhardt F, et al. (2007). Lack of agreement between thermodilution and electrical velocimetry cardiac output measurements. Intensive Care Med. 33(12), 2168-2172.
- Wallace A, Salahieh A, Lawrence A, Spector K, et al. (2000). Endotracheal cardiac output monitor. Anesthesiology, 92(1), 178-189.
- Saugel B, Cecconi M, Wagner JY and Reu. (2015). Noninvasive continuous cardiac output monitoring in perioperative and intensive care medicine. Br J Anaesth. 114(4), 562-575.
- Bundgaard-Nielsen M, Ruhnau B, Secher NH and Kehlet H. (2007). Flow-related techniques for preoperative goal-directed fluid optimization. Br J Anaesth. 98(1), 38-44.
- Truijen J, van Lieshout JJ, Wesselink WA and Westerhof BE. (2012). A recent meta-analysis comprehensively. J Clin Monit Comput. 26(4), 267-278.
- Rivers E, Nguyen B, Havstad S, Ressler J, et al. (2001). Early goal-directed therapy in the treatment of severe sepsis and septic shoc. N. Engl J Med. 345(19), 1368-1377.
- Gan TJ, Soppitt A, Maroof M, El-Moalem H, et al. (2002). Goal-directed intraoperative fluid administration reduces length of hospital stay after major surgery. Anesthesiology. 97(4), 820-826.
- Mora B, Ince I, Birkenberg B, Skhirtladze K, et al. (2011). Validation of cardiac output measurement with the LiDCOTM pulse contour system in patients with impaired left ventricular function after cardiac surgery. Anaesthesia. 66(8), 675- 681.
- Huddart S, Peden CJ, Swart M, McCormick B, et al. (2015). Use of a pathway quality improvement care bundle to reduce mortality after emergency laparotomy. Br J Surg. 102(1), 57-66.
- Miller TE, Thacker JK, White WD, Mantyh C, et al. (2014). Reduced length of hospital stay in colorectal surgery after implementation of an enhanced recovery protocol. Anesth Analg. 118(5), 1052-1061.
- Koff MD, Richard KM, Novak MR, Canneson M, et al. (2010). Elevated PPV Predicts an Increased Length of Stay and Morbidity during High Risk Abdominal Surgery. In Proceedings of the 2010 Annual Meeting of the American Society Anesthesiologists.
- Minto C, Schnider T and Shafer S. (1997). Pharmacokinetics and pharmacodynamics of remifentanil. II. Model application. Anesthesiology. 86(1), 24-33.
- Schnider T, Minto C, Shafer S, Gambus P, et al. (1990). The influence of age on propofol pharmacodynamics. Anesthesiology. 90(6), 1502-1516.
- Jospin M, Aguilar JP, Gambus PL, Jensen EW, et al. (2012). Validation of the qCO cardiac output monitor during Valsalva maneuver. Proc. Annu. Int. Conf. IEEE Eng Med Biol Soc. EMBS. 240-243.
- Patterson RP. (1989). Fundamentals of impedance cardiography. IEEE Eng Med Biol Mag. 8(1), 35-38.
- Carstensen B, Simpson J and Gurrin LC. (2008). Statistical Models for Assessing Agreement in Method Comparison Studies with Replicate Measurements, Int J Biostat. 4(1), 1-26.
- Bland JM and Altman DG. (1999). Measuring agreement in method comparison studies. Stat. Methods Med. Res. 8(2), 135-160.
- Bland JM and Altman DG. (2007). Agreement Between Methods of Measurement with Multiple Observations Per Individual. J Biopharm Stat. 17(4), 571-582.
- Critchley LA and Critchley JA. (1999). A meta-analysis of studies using bias and precision statistics to compare cardiac output measurement techniques. J Clin Monit. Comput. 15(2), 85-91.
- Critchley LA, Lee A and Ho AMH. (2010). A critical review of the ability of continuous cardiac output monitors to measure trends in cardiac output. Anesth Analg. 111(5), 1180-1192.
- Squara P, Cecconi M, Rhodes A, Singer M, et al. (2009). Tracking changes in cardiac output: Methodological considerations for the validation of monitoring devices. Intensive Care Med. 35(10), 1801-1808.
- Phan TD, Kluger R, Wan C, Wong D, et al. (2011). A comparison of three minimally invasive cardiac output devices with thermodilution in elective cardiac surgery. Anaesth. Intensive Care, 39(6), 1014-1021.
- Nordstrom J, Hallsjo-Sander C, Shore R and Bjorne H. (2013). Stroke volume optimization in elective bowel surgery: a comparison between pulse power wave analysis (LiDCOrapid) and oesophageal Doppler (CardioQ). Br J Anaesth. 110(3), 374-380.
- Davies SJ, Minhas S, Wilson RJT, Yates D, et al. (2013). Comparison of stroke volume and fluid responsiveness measurements in commonly used technologies for goal-directed therapy. J Clin Anesth. 25(6), 466-474.
- Costa MG, Chiarandini P, Scudeller L, Vetrugno L, et al. (2014). Uncalibrated continuous cardiac output measurement in liver transplant patients: LiDCOrapidTM system versus pulmonary artery catheter. J Cardiothorac Vasc Anesth. 28(3), 540-546.
- Rich JD, Archer SL and Rich S. (2013). Noninvasive cardiac output measurements in patients with pulmonary hypertension. Eur Respir J. 42(1), 125-133.
- Trinkmann F, Berger M, Doesch C, Papavassiliu T, et al. (2015). Comparison of electrical velocimetry and cardiac magnetic resonance imaging for the non-invasive determination of cardiac output. J Clin Monit. Comput.
- Cecconi M, Dawson D, Grounds RM and Rhodes A. (2009). Lithium dilution cardiac output measurement in the critically ill patient: Determination of precision of the technique. Intensive Care Med. 35(3), 498-504.
- Gabarron E, Escriva J, Jospin M, Jensen EW, et al. (2015). Non-invasive Cardiac Output measurement by impedance plethysmography under general anaesthesia. Euroanaesthesia Eur. Soc. Anaesthesiol. 4-6.