Previous Issues Volume 8, Issue 2 - 2024
Formulation and in Vitro Evaluation of Liquisolid Compact of Celecoxib
Ezegbe Chekwube Andrew1,4,* Anikwe Celestine Chidera2, Uzondu Samuel WisdomofGod3,4, Okorie James Ekemezie1, Okafor Nnedimma Pauline1, Ezegbe Amarachi Grace5, Agu Kenechukwu Christian1, Okorafor Ezinne Chinemerem6, Aniagwu Ifunanya Sheila1
1Department of Pharmaceutical Technology and Industrial Pharmacy, University of Nigeria, Nsukka, Nigeria
2Department of Pharmaceutics, University of Hertfordshire, Hatfield, United Kingdom
3Department of Pharmaceutics, University of Nigeria, Nsukka, Nigeria
4Human and Natural Science Center, ABC Federal University, Santo Andre, Sao Paulo, Brazil
5Department of Home Science and Management, University of Nigeria, Nsukka, Nigeria
6Department of Pharmacology, Federal University of Technology, Owerri, Nigeria
*Corresponding authors
Ezegbe Chekwube Andrew, Department of Pharmaceutical Technology and Industrial Pharmacy, Faculty of Pharmaceutical Sciences, University of Nigeria Nsukka, Enugu State, Nigeria & Federal University of ABC (UFABC), Santo Andre, Brazil, Phone: +2348038042802, E-mail: [email protected]
Amarachi Grace Ezegbe, Department of Home Science and Management, Faculty of Agriculture, University of Nigeria Nsukka, Enugu State, Nigeria, Phone: +2348061114433, E-mail: [email protected]
Received Date: June 06, 2024
Published Date: July 05, 2024
Citation: Andrew EC, et al. (2024). Formulation and in Vitro Evaluation of Liquisolid Compact of Celecoxib. Mathews J Pharma Sci. 8(2):31.
Copyrights: Andrew EC, et al. © (2024).
ABSTRACT
Introduction: The pharmaceutical liquisolid technique has emerged as a promising approach for addressing the challenges associated with poorly water-soluble drugs. The solubility and bioavailability of drugs play a pivotal role in determining their therapeutic efficacy. Aim: To formulate and evaluate celecoxib tablets using the liquisolid technique, in order to enhance its dissolution rate and bioavailability. Method: Celecoxib tablets were prepared using the liquisolid technique by incorporating a non-volatile liquid medication carrier and a suitable coating material. Various formulations were developed by altering the ratios of drug, carrier, and coating materials. The prepared tablets were characterized for their physical properties, drug content uniformity, in vitro dissolution behavior, compatibility using Fourier-transform infrared (FTIR) spectroscopy, morphology using Scanning electron microscopy (SEM) and enthalpy changes using Differential scanning calorimetry (DSC). Results: The solubility profile showed that the maximum rate of dissolution was recorded in PEG-400 (11.03 ± 0.01) when compared to other non-volatile solvents. The angle of slide, indicated that the excipients used were within the acceptable limit of 33o. The FTIR spectroscopy showed compatibility of the drug and excipients. The results of the SEM showed that spherically-shaped vesicles were formed. DSC showed the crystallinity nature of the excipients and the amorphous nature of the optimized formulation. Evaluation of the pre-compression parameters indicated that the drug content was highest in batch F-11 hence its optimization (96.1 ± 0.90 %). The post compression evaluation indicated that the official tests were within the acceptable range for disintegration time (2.25 ± 0.35 mins). The results of the in vitro release studies of the optimized formulation, conventional tablet and reference commercial tablet showed that the amount of drug released increased steadily with time over the 1-hour period. Conclusion: Our findings underscored its viability as a strategy to enhance the therapeutic efficacy of poorly water-soluble drugs. The in-vitro release showed that the liquisolid tablets performed better in terms of release (p < 0.05), when compared with the conventional formulation.
Keywords: Liquisolid, Celecoxib, Carrier, Coating material, Dissolution.
INTRODUCTION
The pharmaceutical liquisolid technique has emerged as a promising approach for addressing the challenges associated with poorly water-soluble drugs. The solubility and bioavailability of drugs play a pivotal role in determining their therapeutic efficacy [1]. Poorly water-soluble drugs often encounter challenges related to achieving adequate plasma concentrations and desired pharmacological responses. Enhancing drug solubility and bioavailability is crucial for improving therapeutic outcomes, reducing the burden on patients, and optimizing the performance of pharmaceutical formulations [2].
The liquisolid technique involves the conversion of liquid drugs or drug solutions into free-flowing, compressible powder blends [3]. This transformation is achieved through the incorporation of drug solutions or suspensions into suitable carrier and coating materials, resulting in the formation of liquisolid compacts [4]. The fundamental principles underlying this technique encompass the use of non-volatile solvents, carrier materials, and coating materials to achieve enhanced drug dissolution and absorption characteristics.
The formulation process for developing liquisolid systems involves the selection of suitable carrier and coating materials, as well as meticulous attention to factors influencing the stability and performance of liquisolid formulations [5]. The versatility of the pharmaceutical liquisolid technique extends to diverse applications in drug delivery. From poorly water-soluble drugs to highly potent compounds, the liquisolid approach offers a viable means of improving drug solubility and bioavailability. Furthermore, the potential for taste masking, modified release, and pediatric formulations further expands the scope of liquisolid applications [6]. Continual advancements in pharmaceutical liquisolid systems have spurred a multitude of research endeavors aimed at refining and expanding the utility of this technique. Novel excipients, innovative processing methods, and the integration of advanced technologies have emerged as key focal points in current research trends. Furthermore, the exploration of personalized medicine and tailored liquisolid formulations signifies a paradigm shift in drug development and formulation strategies [7]. The pharmaceutical liquisolid technique represents a compelling avenue for addressing the formulation challenges associated with poorly water-soluble drugs. Its inherent advantages, coupled with ongoing research innovations, position liquisolid systems as pivotal contributors to advancing drug solubility, bioavailability, and patient-centric drug delivery. As the pharmaceutical industry continues to embrace innovation and scientific exploration, the evolution of liquisolid technology is poised to catalyze transformative developments in drug formulation and therapeutic outcomes [8]. The Liquisolid technique is a revolutionary approach in pharmaceutical formulation that has garnered significant attention for its potential to address the challenges associated with poorly water-soluble drugs. The Liquisolid technique has diverse applications in pharmaceutics, offering advantages such as enhanced drug solubility, improved dissolution rate, and controlled drug release. Due to the difficulty associated with poorly soluble or water insoluble drugs in terms of solubility, dissolution and bioavailability, there is need to formulate a liquisolid dosage form of this drug to bridge the gap [9]. The problem of poor solubility exhibited by class II and IV drugs have been a major challenging issue for the industry especially during the development of ideal solid dosage form. The aim of this research was to formulate and evaluate liquisolid tablets of celecoxib for enhanced solubility, dissolution, bioavailability and improved therapeutic application in the treatment and management of fever, mild to moderate pain and inflammation.
MATERIALS AND METHODS
Celecoxib (CLX1073/11/21) was purchased from Emzor Pharmaceuticals Ltd, Lagos. Polysorbate 80, PEG 4000 were purchased from (Sigma Aldrich, Kosher, USA). Colloidal silicon dioxide (Aerosil X50) was obtained from (Evonik, Germany). Lactose and sodium starch glycolate were obtained from DFE Pharma, UK), Sorbitol was obtained from (TCI, USA). Microcrystalline cellulose (MCC) and magnesium stearate were obtained from (Central drug house Ltd, New Delhi, India). Methanol was obtained from (Astron Chemicals, Ahmedabad). Glycerin and sodium hydroxide were provided by (Mingtai Chemical, Taiwan). Distilled water was obtained from (UNN Water Resources Management Laboratories Ltd; UNN, Enugu State, Nigeria).
Solubility studies
The solubility of celecoxib was determined in various lipophilic solvents (Phosphate buffer pH 6.8, pH 7.4, 0.1N HCl, Tween 80, Propylene glycol, Polyethylene glycol (PEG-400 and distilled water). Saturated solutions were prepared by adding excess drug (5 g) to the vehicles (1 ml). Excess drug was stirred in above solvent, then sonicated for thirty (30) minutes and kept for twenty-four (24) hours. After this period, the solutions were filtered, diluted and analysed by UV spectrophotometer. Three determinations were carried out for each drug sample to calculate the solubility of the drug at 252 nm [10].
Drug-excipient compatibility study (FTIR spectroscopy)
Infra-red spectra of pure drug, carrier and coating materials were obtained by (Shimadzu 8400S Japan) FT-IR spectrometer. The samples were previously ground and mixed thoroughly with potassium bromide, an infra-red transparent matrix at 1:5 (sample: KRr) ratio respectively. The KBr discs were prepared by compressing the powders at a pressure of 5 tons for 5 minutes in a hydraulic press. The scans were obtained at a resolution of 4 cm-1 from 4000 to 400 cm-1 [11].
Differential scanning colorimetry (DSC)
Thermal curves of pure drug, carrier, coating material and optimized formulation were recorded by simultaneous differential scanning calorimeter (DSC Q 200 V 24.4 Build 116). Each sample (approximately 2.5 mg) was scanned in hermetic pan made of aluminum at heating rate of 10 oC/min over the range of 50 oC -220 oC with an empty aluminum pan used as reference. Samples were heated under nitrogen atmosphere (flow rate of N2-50 ml/min) [11].
SEM analysis for optimized formulation
Scanning electron microscopy was used to assess the morphological characteristics of the final liquisolid compacts. The samples were fixed on aluminum stubs with double-sided tape, gold coated sputter examined in the microscope using an accelerating voltage of 15 kv at a working distance of 8 mm and magnification of x10000 [11].
Powder x-ray diffraction studies
Powder x-ray diffraction pattern of celecoxib, carrier and coating material were studied using the x-ray diffractometer (XRD-462, Digaku, Japan). Voltage and current were set at 40 KV and 30 mA respectively. All pattern scanned over range 5-70o 2ϴ angle with a scan speed of 10 o/min [11].
Flowable liquid-retention potential (Ø value) of the excipients
Determination of the angle of slide
The carrier and coating material were weighed out accurately and placed at one end of a metal plate with a polished surface. The end was raised gradually until the plate made an angle with the horizontal at which was a measure for the flow characters of powders [12].
Figure 1. Angle of slide measurement [12].
Determination of flowable liquid-retention potential (Ø value)
To the log of excipients, increasing amount of liquid vehicle were added and mixed well. The excipients adsorbed liquid vehicle resulting in a change in its flow properties. At each concentration of liquid vehicle added, the angle of slide ϴ for excipients were re-determined as stated above. The corresponding Ø angle was calculated from the following equation.
Ø value = weight of liquid/weight of solid- - - - - - - 1
The Ø values were plotted graphically against the corresponding angles of slide (h). The Ø value corresponding to an angle of slide 33o represented the flowable liquid-retention potential of excipients [13].
Determination of the liquid load factor (Lf)
A powder is known to retain certain limited amount of liquid medication, while maintaining an acceptable limit of flowability and compressibility. There are established mathematical models used to calculate the amount of liquid that can be loaded into the powder which would result into an acceptably free flowing and readily compressible dry looking powder [14].
Lfⱷ = Ø + ⱷ/R - - - - - - - - -2
Ø : Flowable liquid retention potential of carrier.
ⱷ: Flowable liquid retention potential of coating material.
R = Carriers and coating material ratio.
R = Q/q Q = Carrier weight, q = coat weight. - - - - -3
Weight of carrier and coating material can be calculated by the equation
Lfo = weight of liquid medication (W) (drug+non-volatile solvent)/Carrier weight (Q)- - -4
Lfo = Optimal liquid load factor.
Procedure for preparation of liquisolid system
Several celecoxib liquisolid formulations were prepared in batches of 100 tablets at different ratios of (1:1, 1:2, 1:3 and 1:4) drug: liquid vehicle. Calculated quantities of the drug and non-volatile solvent were accurately weighed in a 20-ml glass beaker and then mixed well. The resulting medication was incorporated into calculated quantities of carrier and coating materials. The mixing process was carried out in three steps:
In the first, the system was blended at an appropriate mixing rate of one rotation per second for approximately one minute in order to evenly distribute liquid medication in the powder.
In the second, the liquid/powder admixture was evenly spread as a uniform layer on the surface of a mortar and left standing for approximately 5 minutes to allow the drug solution to be absorbed inside powder particles.
In the third, the powder was scraped off the mortar surface using an aluminum spatula. Subsequently carrier: coating material was added to this mixture and blended in a mortar. Starch (5 % w/w) was added as a disintegrant and magnesium stearate (1 % w/w) was added as a lubricant. Final formulation was compressed into tablets using a 12 mm single punch tablet compression machine [15].
Procedure for preparation of directly compressed tablets (DCTs)
Celecoxib conventional tablets were produced by mixing the drug with the actual quantities of carrier and coating materials, for a period of 10 minutes in a cubic mixer (Erweka, Germany). The mixture was then mixed with starch as disintegrating agent for 10 minutes and then magnesium stearate (1 %) was mixed for 5 minutes. The final mixture was compressed using the tablet punching machine [16].
Pre-compression evaluation of powder blend
Angle of repose
Angle of repose is defined as the maximum angle possible between the surface of a pile of the powder and the horizontal plane. A plastic funnel in ring-supported by a retort stand. A sheet of paper was placed below the funnel assembly. A sheet of fibre board was placed below the funnel orifice making sure it fits tightly. A given quantity of the powder (30 g) was transferred into the funnel. The fibre sheet was drawn away and the timer simultaneously started. The timer was stopped when all of the powder had passed through the funnel. The height of the heap was measured using a graduated ruler. A pencil was used to outline the base of the contour. The angle of the conical heap so formed was determined from equation 5. The powder was returned to the funnel and the experiment was repeated thrice [17]:
Tan ϴ = height of powder heap (h)/(radius of powder heap, (r) - - - - - - -5
Bulk density
This is the ratio between given mass of powder and its bulk volume. A weighed quantity of powder (30.0 g) was placed in a 100-ml graduated cylinder. The cylinder was gently dropped onto a wooden surface three times from a height of one inch at 2 sec interval. The volume assumed after the treatment was taken as the bulk volume. The experiment was repeated thrice [17]:
Bulk density (g/ml) = mass/bulk volume - - - - - - -6
Tapped density
This is the ratio between given mass of powder and its bulk volume. A weighed quantity (30.0 g) of the powder was placed in a 100-ml graduated cylinder. The cylinder was tapped up to 500 times on the wooden surface or to a constant volume. The final volume attained represents the tapped volume. The experiment was repeated thrice [17]:
Tapped density (g/ml) = mass/tapped volume - - - - - - 7
Carr’s index
This is used to access the flowability of a powder. The Carr’s compressibility index (CI %) was calculated from the poured (bulk density) and tapped densities. CI was calculated using the following equation [17]:
Carr’s index = Tapped density-bulk density/Tapped density x 100 - - - - - - -8
Hausner’s ratio
The Hausner ratio (HR), defined as the ratio of tapped to bulk densities. It is a common technique widely used to describe the packing behavior of powders when they are subjected to tapping.
Hausner’s ratio = tapped density/bulk density ------ --9
Drug content
The powder blend containing 10 mg equivalent of drug was weighed and dissolved in methanol, and the volume was made up to 100 ml with distilled water. From the above solution, 10 ml was taken and diluted with distilled water. The absorbance of resulting solution was measured at 252 nm for celecoxib using the spectrophotometer (Spectumlab 725S, Hitachi Japan).
Post compressional evaluation of liquisolid tablets
Organoleptic properties
The formulated tablets were evaluated for organoleptic properties such as colour, odour, taste and appearance.
Thickness
Ten (10) tablets were randomly selected from each formulation and thickness was measured individually by Vernier caliper. The thickness test was repeated 3 times. The mean and standard deviation were then calculated [17].
Hardness
Ten (10) tablets were randomly selected from each batch. Using the Monsanto hardness tester (Praveen Enterprises, Bangalore), the pointer was fixed at 0 Kgf. One tablet was held and placed with the tester holder and the screw adjusted until the pressure applied cracked the tablet. The hardness test was repeated 3 times. The mean and standard deviation were then calculated [17].
Friability test
Ten (10) tablets were selected at random from each batch. Subsequently, they were dedusted and accurately weighed together in an analytical balance. The dedusted tablets were then placed into the friabilator which was set to rotate at 25 rpm for 4 minutes. Then the tablets were removed, dedusted and re-weighed. The mean loss in weight and percent friability was then calculated. The friability test was repeated 3 times. The mean and standard deviation were then calculated [17].
Friability test = initial weight-final weight/initial weight x 100 -----10
Uniformity of weight test
Twenty (20) tablets were randomly selected from each batch. Using the analytical balance (120-5DM, S. Mettler, Germany), the 20 tablets were weighed together. The mean tablet weight was then calculated. Subsequently the tablets were weighed individually and the weights of the tablets recorded. The variations of individual tablet weights from the mean weight were determined, and the percentage deviations calculated:
Percentage deviation = Deviation/Mean weight x 100 - - - - - -11
Drug content
The total amount of drug present in the liquisolid formulation was evaluated using UV-spectrophotometric analysis. Approximately weighed quantity of 10 mg equivalent of drug was taken from liquisolid formulation which was dissolved in 10 ml of methanol and the volume was made up to 100 ml with distilled water. From the above solution, 10 ml was taken and diluted with distilled water. The absorbance of resulting solution was measured at 252 nm for celecoxib using Spectrophotometer (Shimadzu UV-1700 Pharma Spec, Japan) and the drug content was calculated from the standard curve using the formula [17].
Drug content = Sample absorbance/Standard absorbance x 100 - - - - - - 12
Disintegration test
Six (6) tablets were selected at random from each batch using the Erweka disintegrating unit and distilled water as the disintegrating medium maintained at 37 ± 1.0 oC. One tablet was placed into each tube of the disintegrating unit. The time taken for each tablet to completely break down to particles and pass through the wire mesh was recorded. The disintegration test was repeated 3 times. The mean and standard deviation were then calculated [17].
In vitro release studies
The in vitro release studies was performed by using type II paddle dissolution apparatus in 900 ml of distilled water maintained at 37 oC ± 0.5 oC and rotation speed of 50 rpm. All batches of tablets were evaluated in gastrointestinal release medium (0.1 N HCl, pH 1.2) for one hour. Samples (5ml) were withdrawn at suitable time intervals (5, 10, 15, 20, 25, 30, 45, and 60) minutes and filtered through 0.45 micron Whatman filter paper. Sink conditions were maintained throughout the study. The withdrawn samples were analysed by uv-visible spectrophotometer (Shimadzu uv-1700 Pharma Spec, Japan) at maximum wavelength of 252 nm for celecoxib. The studies were done in triplicates [18].
In vitro drug release kinetics
Various kinetic models were used to describe the in vitro release kinetics and mechanisms of drug release from the liquisolid tablets. The zero-order kinetics explains the systems where the drug release rate is independent of its concentration (eqn. 13). The first order kinetics is used to describe the release from systems where the release rate is dependent on concentration (eqn. 14). Higuchi model describes the release of drugs from the insoluble matrix as a square root of time (eqn. 15). Korsmeyer is used to describe the drug release from a polymeric system (eqn. 16) [19]:
Co- Ct = Kot
Ct = Co + Kot - - - - - - - - - 13
Ct is the amount of drug released at time t,
Co is the initial concentration of drug at time t = 0,
Ko is the zero-order rate constant.
Log C = log Co – K1t/2.303 - - - - - - - - 14
Kt is the first order rate equation expressed in time -1 or per hour,
Co is the initial concentration of the drug, C is the percent of drug remaining at time t
ft = Q = KH . t1/2 - - - - - - - - - - 15
where, Q is the amount of drug released in time t per unit area , KH is the Higuchi dissolution constant
Mt / M∞ = Kkptn - - - - - - - - - 16
where, Mt / M∞ is a fraction of drug released at time t, Kkp is the Korsmeyer release rate constant and n is the release exponent. The n value is used to characterize different release for cylindrical shaped matrices and the value of n characterizes the release mechanism of drug.
Selection and evaluation of optimized formulation
The optimized formulation was selected on the results obtained from solubility studies in various non-volatile solvents, drug content and in vitro release studies.
Formulation design
Design Expert® 12.0 software was used to create formulation design for the purpose of optimization of liquisolid tablets. Two independent factors were used to suit the experimental needs viz. concentration of the nonvolatile solvent and carrier: coat ratio (R). Dependent factors used were drug release (%), angle of repose (o). Central composite randomized design was applied to screen via response surface methodology. Response 1 and 2 was evaluated by quadratic model and Response 3 by linear model by ANOVA. The estimations for the cumulative drug release and angle of repose were set at the ranges of 80-99 % and 25-35o respectively [20; 21].
Data analysis
All the measurements were repeated at least thrice and the data obtained analyzed by Student t-test and One-Way Analysis of Variance (ANOVA). Statistical analysis was performed using Statistical Product and Services Solution software (SPSS, version 22.0 Inc., Chicago IL, USA) and Excel Microsoft Office version 2012. The results were presented as mean ± SD, and statistical differences between means considered significant at (p < 0.05).
Results and Discussion
Solubility profile of Celecoxib in various solvents.
The solubility profile of celecoxib indicated that the drug is practically insoluble in water (0.05 mg/ml). Minimal solubility was recorded in acidic environment (0.1 N HCl). The non-volatile solvent that gave the highest degree of solubility was PEG 400, thus it was used as the solvent of choice in the formulation of celecoxib liquisolid tablets.
According to Alireza H et al; (2014), the results of the solubility studies indicated that pure celecoxib had very low solubility in water at 25 oC (3 ± 0.68 µg/ml) [22].
Table 1. Solubility profile of Celecoxib in various solvents (mean ± SD)
|
Solvent/vehicle |
Celecoxib |
|
Distilled water |
0.05 ± 0.01 |
|
Tween-80 |
11.03 ± 0.01 |
|
PEG 400 |
13.10 ± 0.36 |
|
Propylene glycol |
10.07 ± 0.02 |
|
Glycerin |
08.02 ± 0.33 |
|
Methanol |
4.11 ± 0.39 |
|
Glacial acetic acid |
2.08 ± 0.06 |
|
Buffer pH 7.4 |
2.01 ± 0.02 |
|
Buffer pH 6.8 |
2.10 ± 0.28 |
|
0.1N HCl. |
01.09 ± 0.35 |
Liquid retention potential and liquid load factor
At a given ratio of 1/R, different Lf was obtained and graph of Lf against 1/R was given.
From the graph equation Y = 0.3185 + 1.4604 X and it was compared to Lf = Lfⱷ = Ø + ⱷ (1/R) where Ø is the liquid retention potential of carrier and ⱷ is the liquid retention potential of coating material. Thus the flowable liquid retention potential of carrier and coating material was found to be 0.3185 and 1.4604 respectively.
Angle of slide for API, carrier and coating materials
Table 2 depicted the angle of slide for the active ingredient, carrier and coating materials. Angle of slide indicates the flow property of powder compact. Increase in carrier coating ratio leads to an increase in angle of slide which indicates poor flow property [23]. For liquisolid powders 33o is considered optimum and acceptable angle. The flow properties of powders are very crucial in efficient tableting operation. It ensures efficient mixing and acceptable weight uniformity for the compressed tablets. The essence of determining the angle of slide is to help identify drugs that are poorly flowable at the pre-formulation stage. This problem can be solved by selecting appropriate excipients. Table 2 indicated that the carrier materials (maize starch and lactose) had an angle of slide at 33.0 ± 1.4 and 33.0 ± 0.00 respectively without a significant difference (p < 0.05), thus signifying an optimum and acceptable angle. The coating material (SiO2) had an angle of slide at 33.5 ± 0.35, while magnesium stearate (lubricant) had an acceptable angle of slide at 33.0 ± 2.83. Celecoxib had an angle of slide at 36.0 ± 0.71. This value was above the acceptable angle of 33o, thus the need to select appropriate excipients to handle the poor flowability of the drug at the pre-formulation stage.
Table 2. Angle of slide of drug and excipients (mean ± SD)
|
Drug/excipient |
Angle of slide (o) (mean ± SD) |
|
Maize starch |
33.0 ± 1.40 |
|
Lactose |
33.0 ± 0.00 |
|
Magnesium stearate |
33.0 ± 2.83 |
|
Microcrystalline cellulose |
32.0 ± 2.12 |
|
Celecoxib |
36.0 ± 0.71 |
|
Silicon dioxide (SiO2) |
33.5 ± 0.35 |
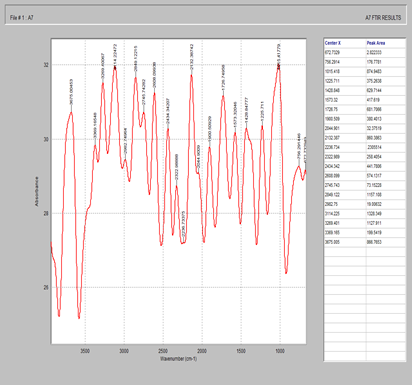
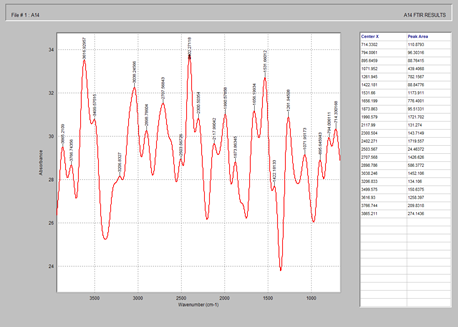
Fig. 2 showed the characteristic peaks of celecoxib at 3819.7, 3211.5, 2590.9, 1880.6 and 1347.4 cm-1 corresponding to -OH, -NH single bond stretch, C-H single bong stretch, nitriles, C=O, C=C and C=N and C-O, C-N, C-C single bond stretch respectively. According to Gulshan et al; celecoxib showed characteristic peaks at 1159 cm-1 due to S=O stretching, 3338 cm-1 to NH2 stretching and 1563 cm-1 due to N-H stretching [24].
Fig. 3 showed the characteristics peaks of microcrystalline cellulose (MCC) at 3925.2, 3245.2, 2582.1, 1997.8 and 1468.4 cm-1 corresponding to O-H, N-H single bond stretch, C-H single bond stretch, carbenes triple bond, C=O, C=C double bond and C-C, C-O single bond respectively. According to Ning et al. [25], the spectrum of MCC showed characteristic peaks at 3390 and a band at 1636 cm-1 corresponding to the stretching and bending modes of the surface hydroxyls. The peak at 2905 cm-1 belongs to the asymmetrically stretching vibration of C-H in a pyramid ring and the broad absorption peak at 1059 cm-1 is attributed to the C-O of cellulose.
Fig. 4 showed the characteristic peaks of silicon dioxide at 3852.3, 3169.1, 2554.2, 1993.8 and 1495.6 cm-1 corresponding to O-H, N-H single bond stretch, C-H single bond stretch, nitriles and carbenes triple bond, C=O, C=C double bond and C-O, C-C single bond respectively. According to Saravanan et al, the spectrum of SiO2 showed characteristic peaks at 3700 cm-1 indicating the presence of –OH stretching bond. The strong bonds at 1093, 459 and 798 cm-1 were associated to the asymmetric and symmetric Si-O—Si stretching vibration bonding [26].
Fig. 5 showed the characteristic peaks of starch at 3675.0, 3269.4, 2434.3, 1900.5 and 1428.8 corresponding to –O-H, single bond stretch, C-H single bond stretch, nitriles and carbenes triple bond, C=O C=C double bond, C-O, C-C single bond respectively. According to Abdullah et al; the spectrum of starch showed characteristics peaks at 3448 for –OH stretching, 2930 for –CH stretching, 1646 for C-O bending associated with OH group, and 1381 cm-1 associated with –CH symmetric bending [27].
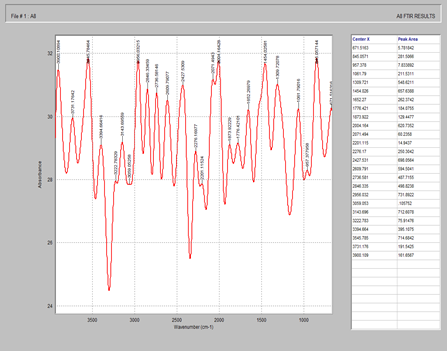
Fig. 6 showed the characteristic peaks of magnesium stearate at 3900.1, 3143.6, 2427.5, 1873.9 and 1454.0 cm-1 corresponding to –OH, -NH single bond stretch, -CH single bond stretch, C=O, C=C and C-O, C-C single bond respectively. According to Sue et al; (2006), the twin peaks at 1577 and 1466 cm-1 were attributed to asymmetric carbohydrate (-COO) stretching vibration and symmetric carbohydrate vibration respectively, while peaks at 2917 and 2850 cm-1 were attributed to the –CH stretching vibration [28].
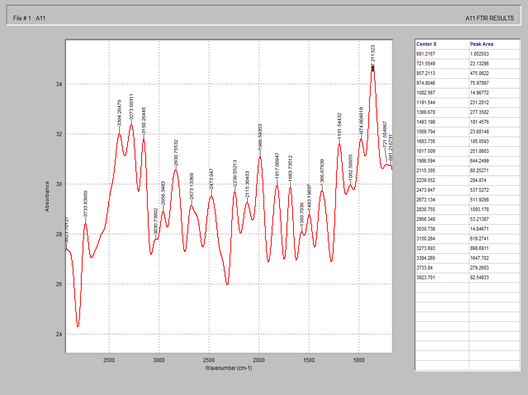
Fig. 7 showed the characteristic peaks of celecoxib + MCC + starch + magnesium stearate + SiO2. When compared with the pure drug, there was no characteristic change in the above peaks, thus there was no incompatibility with the excipients utilized in the formulation of liquisolid compacts.
Fig. 8 showed the characteristic peaks of Tween 80, a non-volatile solvent at 3802.8, 2934.6, 2385.6, 2085.6, 2088.5 and 1392.1 cm-1 corresponding to –OH single bond stretch, -CH single bond stretch, carbenes, C=C, C=O double bond and C-C, C-O single bond respectively. According to Ran et al; the FTIR spectrum of Tween 80 showed asymmetric and symmetric stretching bands of (-CH2) at 2907 and 2855 cm-1 respectively, a stretching band at 1735 cm-1 due to the C=O ester group and a strong band at 3436 cm-1 associated with the hydroxyl stretching vibrations.
Fig. 9 showed the characteristic peaks of PEG 400 at 3865.2, 2503.5, 1990.5 and 1422.1 cm-1 corresponding to –OH single bond stretch, -CH single bond stretch, C=C and C-C double and single bonds respectively.
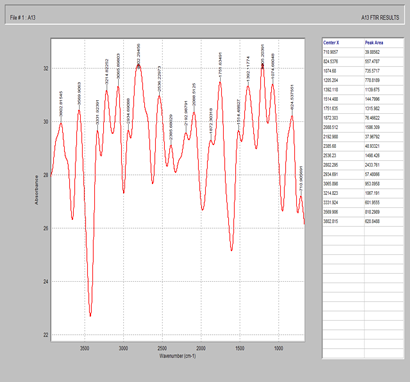
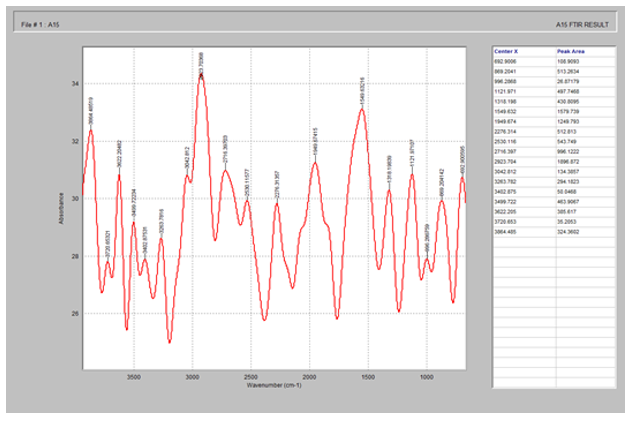
Fig. 10 showed the characteristic peaks of lactose at 3864.4, 3263.7, 1949.6 and 1121.9 cm-1 corresponding to -OH single bond stretch, -CH single bond stretch, C=C and C-C double and single bond respectively.
Figure 2. FTIR spectrum of Celecoxib
Figure 3. FTIR of microcrystalline cellulose
Figure 4. FTIR spectrum of silicon dioxide
Figure 5. FTIR spectrum of starch
Figure 6. FTIR spectrum of magnesium stearate
Figure 7. FTIR spectrum of celecoxib + MCC + starch + magnesium stearate + silicon dioxide
Figure 8. FTIR spectrum of Tween 80
Figure 9. FTIR spectrum of PEG 4000
Figure 10. FTIR spectrum of lactose
Differential scanning colorimetry
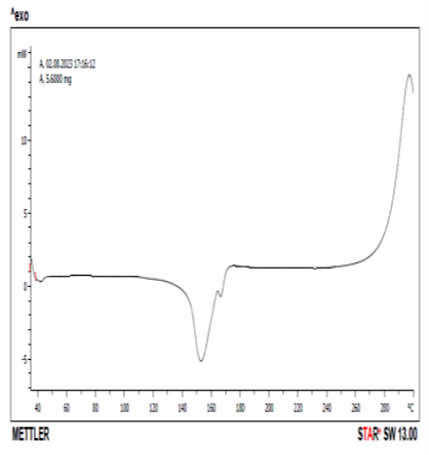
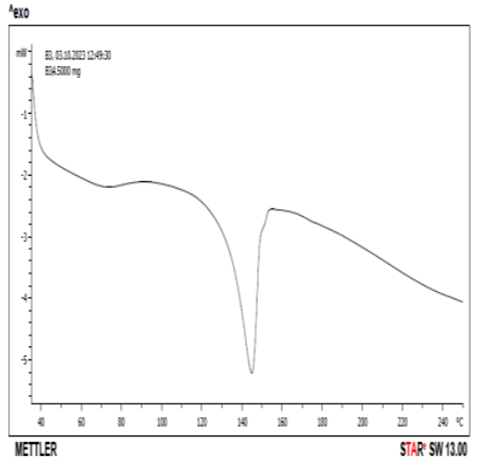
DSC thermogram of pure drug and drug +excipient were shown in Figs. 11 and 12. Pure celecoxib showed sharp endothermic peak at 158 oC corresponding to the melting temperature. According to Koizumi et al (2001), celecoxib showed an endothermic peak with a melting point at 159.49 oC which agreed with the literature value of 160.8 oC. Fig. 12 showed the DSC thermogram of celecoxib and lactose at 145 oC. There was a reduction in the peak from 158 oC of pure celecoxib to 145 oC in the mixture of celecoxib and lactose. According to Macheras et al (2000), pure celecoxib gave an endothermal peak at 170 oC which is related to the melting point of celecoxib. The pure lactose gave two endothermic peaks at 150 and 221 oC respectively, while the combination of celecoxib and lactose gave three endothermic peaks at 150 oC, 170 oC and 220 oC respectively. This could be evidence of drug-excipient (celecoxib-lactose) compatibility [29,30].
Figure 11. DSC thermogram of Celecoxib
Figure 12. DSC thermogram of Celecoxib + lactose
Scanning electron microscopy
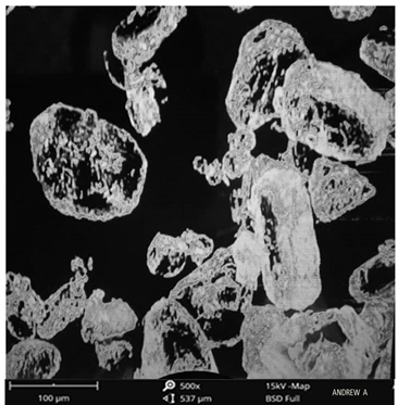
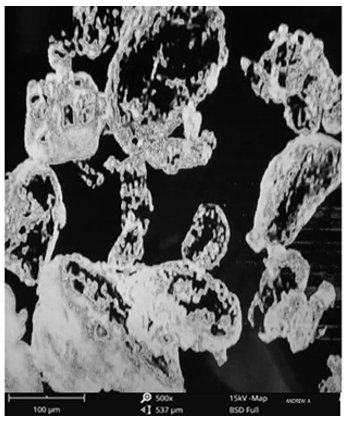
The surface morphology of the pure drug was scanned using the scanning electron microscopy as shown in Figs. 13 and 14 for the pure drug and the optimized formulation. The result showed that crystals of pure celecoxib had irregular shapes with large spherical particles. For optimized formulation, both formed irregular shapes with a smooth surface [31].
Figure 13. SEM of Celecoxib
Figure 14. SEM of optimized formulation
Powder-X-Ray Diffraction studies
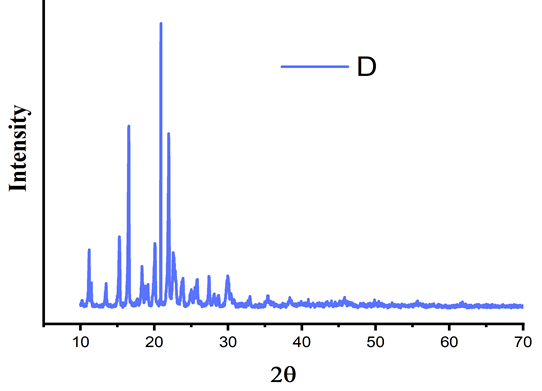
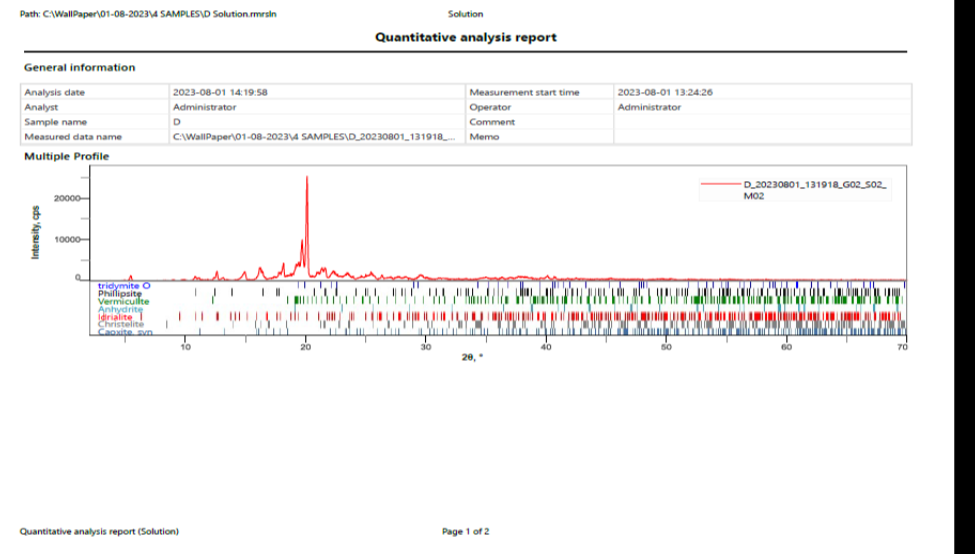
One of the important factors that affect the dissolution rate of dug and its bioavailability is the polymeric changes in the drug. The crystalline nature of the pure API was studied by the characteristic PXRD pattern which showed sharp peaks for pure celecoxib, sharp characteristic peaks were recorded at 15o, 20o, 22o at 2ϴ. Fig. 16 showed the PXRD pattern of celecoxib and lactose. The mixture showed that sharp characteristic peak was obtained at 19o at 2ϴ. The mixture of the x-ray diffraction pattern showed absence of these characteristic peaks of drug which indicated that the pure drug was converted into amorphous or solubilized form.
According to Darlene et al, pure crystalline celecoxib showed its most characteristic diffraction peaks at specific angles of 5.4o, 10.8o, 16.1o, 21.1o, 22.2o and 27.0o, while 16.1o and 21.1o were the two peaks with the strongest intensity. This is in agreement with the reported diffraction patterns of pure crystalline celecoxib. The characteristic diffraction peaks of pure crystalline celecoxib disappeared when mixed with lactose [32].
Figure 15. XRD pattern of celecoxib
Figure 16. XRD pattern of Celecoxib and lactose
Evaluation of liquisolid granules and conventional tablet
Angle of repose
The angle of repose is a characteristic of the internal function or cohesion of the particles. If a powder is non-cohesive, the angle of repose will be high, but if a powder is cohesive, the angle of repose will be low [33].
For the celecoxib liquisolid granules, the angle of repose for the pure drug was 27.22 ± 0.05, while that of the conventional tablet was 24.32 ± 0.38. The formulation with the extracted and reference lecithin recorded 0.23 ± 0.01 and 0.25 ± 0.03 respectively. The lowest angle of repose was recorded in F-EL, while the highest was recorded in F-5 (27.75 ± 1.09).
Bulk density
Bulk density was used to measure the flow properties of the powder. It is a function of the particle size and particle size distribution. It has a direct relationship with the flow characteristics of a powder [33]. For celecoxib, the angle of repose of the pure drug was 27.22 ± 0.05, while that of the CT was 24.32 ± 0.38. The formulation with the extracted and reference lecithin recorded 0.23 ± 0.01 and 0.25 ± 0.03 respectively. The lowest value was recorded in F-EL (23.90 ± 0.11), while the highest value was recorded in F-5 (27.75 ± 1.09) without a significant difference (p <0.05).
Tapped density
Tapped density is a function of particle size and size distribution [33]. For celecoxib powder blend, the pure drug was 0.30 ± 0.01, while that of the conventional tablet was 0.34 ± 0.01. The formulation with extracted and reference lecithin recorded 0.29 ± 0.02 and 0.32 ± 0.01 respectively without a significant difference (p <0.05).
Carr’s Index (Compressibility index)
This is affected by particle size and particle size distribution. According to BP specifications, excellent free flowing granules range from 5-15 %, while good free flowing granules range from 12-16 % [33]. Very poor fluid cohesive powders have C.I of > 38 %, while powders with C.I. > 40 % indicates very poor flow.
Hausners ratio (HR)
It has a direct relationship between he tapped and bulk density. According to specifications, excellent free flowing granules range from 1.00 ± 1.11, while good free flowing granules range from 1.12 to 1.18. Very poor fluid cohesive powders have H.R. of 1.6 to 1.59. For celecoxib, the pure drug was 1.15 ± 0.01, while that of the conventional tablet was 1.27 ± 0.04 without a significant difference (p <0.05). The extracted and reference lecithin recorded 16.05 ± 0.60 and 16.90 ± 0.70 respectively.
Drug content
The drug content was used to determine the uniform amount of pharmaceutical active ingredients that were present in all the formulations [33]. Celecoxib powder blend, indicated that the drug content was within the range of 95.4 ± 0.65 to 99.0 ± 1.07. They were within the acceptable range as specified in the Indian Pharmacopoeia.
Table 3. Evaluation of precompression parameters of liquisolid granules of Celecoxib (n =3, all values are written as Mean ± SD)
|
Pure drug/codes |
Angle of repose (o) |
Bulk density (g/ml) |
Tapped density (g/ml) |
Hausners Ratio |
Compressibility index (%) |
|
Celecoxib |
27.22 ± 0.05 |
0.23 ± 0.01 |
0.30 ± 0.01 |
1.15 ± 0.01 |
21.32 ± 2.89 |
|
F-1 |
26.52 ± 0.79 |
0.24 ± 0.01 |
0.34 ± 0.03 |
1.17 ± 0.01 |
20.08 ± 2.11 |
|
F-2 |
24.12 ± 1.21 |
0.25 ± 0.01 |
0.25 ± 0.01 |
1.14 ± 0.02 |
20.51 ± 1.47 |
|
F-3 |
24.75 ± 1.44 |
0.25 ± 0.01 |
0.29 ± 0.01 |
1.18 ± 0.01 |
19.92 ± 1.83 |
|
F-4 |
25.85 ± 0.38 |
0.25 ± 0.01 |
0.26 ± 0.01 |
1.23 ± 0.01 |
19.82 ± 1.75 |
|
F-5 |
27.75 ± 1.09 |
0.23 ± 0.01 |
0.29 ± 0.01 |
1.17 ± 0.01 |
20.92 ± 0.41 |
|
F-6 |
24.92 ± 0.93 |
0.24 ± 0.01 |
0.34 ± 0.01 |
1.18 ± 0.03 |
19.31 ± 1.48 |
|
F-7 |
25.95 ± 0.45 |
0.23 ± 0.01 |
0.31 ± 0.01 |
1.18 ± 0.02 |
19.52 ± 0.76 |
|
F-8 |
25.72 ± 0.22 |
0.25 ± 0.01 |
0.28 ± 0.01 |
1.25 ± 0.01 |
19.96 ± 0.38 |
|
F-9 |
25.87 ± 1.25 |
0.25 ± 0.01 |
0.27 ± 0.01 |
1.26 ± 0.02 |
17.86 ± 1.01 |
|
F-10 |
24.57 ± 1.18 |
0.28 ± 0.02 |
0.27 ± 0.01 |
1.24 ± 0.01 |
19.79 ± 0.45 |
|
F-11 |
24.82 ± 0.44 |
0.27 ± 0.01 |
0.30 ± 0.01 |
1.24 ± 0.01 |
22.42 ± 2.72 |
|
F-12 |
26.72 ± 0.93 |
0.30 ± 0.01 |
0.35 ± 0.01 |
1.13 ± 0.01 |
14.04 ± 0.94 |
|
CT |
24.32 ± 0.38 |
0.24 ± 0.01 |
0.34 ± 0.01 |
1.27 ± 0.04 |
18.00 ± 0.36 |
F-1 to F-4, CT: lactose, F1-F6: Silicon dioxide (SiO2) F1-F6, CT: Maize starch
F-5 to F-8: Sorbitol F7-F12, CT: Talc. F7-F12: Sodium starch glycolate.
F-9 to F-12: MCC. CT: Conventional tablet (without non-volatile solvent)
Table 4. Drug content of Celecoxib powder blend (n =3, all values are written as Mean ± SD)
|
Formulation code |
Celecoxib |
|
F-1 |
97.1 ± 1.59 |
|
F-2 |
97.4 ± 0.07 |
|
F-3 |
96.9 ± 0.38 |
|
F-4 |
97.0 ± 0.15 |
|
F-5 |
96.7 ± 0.42 |
|
F-6 |
95.9 ± 0.65 |
|
F-7 |
96.3 ± 0.31 |
|
F-8 |
95.4 ± 0.65 |
|
F-9 |
96.9 ± 0.58 |
|
F-10 |
95.9 ± 0.40 |
|
F-11 |
96.1 ± 0.90 |
|
F-12 |
95.7 ± 0.74 |
|
CT |
95.7 ± 0.98 |
F-1 to F-4, CT: lactose, F1-F6: Silicon dioxide (SiO2) F1-F6, CT: Maize starch
F-5 to F-8: Sorbitol F7-F12, CT: Talc. F7-F12: Sodium starch glycolate.
F-9 to F-12: MCC. CT: Conventional tablet (without non-volatile solvent)
Post compressional evaluation of liquisolid tablets
For each drug, the different formulations were evaluated for the post compressional parameters such as general appearance, uniformity of weight, hardness, friability, disintegration time and thickness and diameter.
General appearance of tablets
The formulated liquisolid tablets were white in colour, with both standard capsule and round shape. All the liquisolid tablets were elegant in appearance.
Tablet thickness
For celecoxib, the thickness values were found in the range of 3.85 ± 0.60 for batch reference commercial tablet (R-CT) to 4.90 ± 0.00 for batch F-3 respectively. Mechanical wear and imperfections in the pressing or tooling may also introduce variability which can cause buildup of materials on the punch face and the die wall. These factors may subsequently affect tablet weight and the physical consistency of manufactured tablets.
Friability
Tablets are always subjected to mechanical shocks during handling, packaging and transportation. When this happens, the stress on the tablets could lead to chipping, breaking or capping. Other factors that could affect tablet strength include the poor tablet design, low moisture content, insufficient binder and over lubrication. Friability of a tablet is determined using the Roche friabilator. It consists of a plastic chamber that revolves at 25 rpm dropping the tablets through a distance of six inches in the friabilator which is operated for 100 revolutions. Acceptable range for tablet friability is 0.5 to 1 % [33]. Celecoxib recorded a friability range was 0.40 ± 0.00 for reference commercial tablet and 0.66 ± 0.01 for batch F-3. They were within the acceptable limit for friability.
Disintegration
The disintegration time of all the tablet formulations were determined using the disintegration test apparatus. The disintegration test is used to show how quickly the tablet breaks down into smaller particles thereby allowing for a greater surface area and availability of the drug.
Celecoxib recorded a disintegration time of 4.25 ± 0.10 for batch F-3 and 12.40 ± 0.21 for batch reference commercial tablet (R-CT), without a significant difference (p< 0.05). They were within the acceptable limits for uncoated tablets.
Weight variation
The weight variation was used to determine the uniformity of the tablets in all formulations. The result obtained, showed that all the formulated tablets passed the weight variations within the acceptable limit as per Indian Pharmacopoeia (none of the formulated tablets weight differed from the mean by more than 10 %). According to BP 1988 specification for uncoated tablets, the mean weight for 20 tablets recorded, the tablets weighing 80 mg or less should not deviate by more than 10 %, while for tablets weighing between 80-250 mg should not deviate by more than 7.5 %. For tablets weighing 250 m g or more, the deviation should not be more than 5 %
Table 5. Post-compressional evaluation of liquisolid tablets of Celecoxib (n =3, all values are written as Mean ± SD)
|
Formulation code |
General appearance |
Hardness (kg/cm2) |
Thickness (mm) |
Diameter (mm) |
Weight variation (mg) |
Friability (%) |
Disintegration time (sec) |
|
F-1 |
White |
5.15 ± 0.74 |
4.50 ± 0.28 |
5.31 ± 0.20 |
666.4 ± 3.95 |
0.61 ± 0.07 |
4.65 ± 0.10 |
|
F-2 |
White |
4.90 ± 0.56 |
4.60 ± 0.21 |
5.15 ± 0.29 |
677.4 ± 1.62 |
0.59 ± 0.08 |
5.45 ± 0.17 |
|
F-3 |
White |
4.60 ± 0.35 |
4.90 ± 0.00 |
4.95 ± 0.10 |
686.0 ± 2.86 |
0.66 ± 0.01 |
4.25 ± 0.10 |
|
F-4 |
White |
4.55 ± 0.31 |
4.45 ± 0.24 |
4.80 ± 0.07 |
750.8 ± 2.68 |
0.47 ± 0.12 |
5.50 ± 0.28 |
|
F-5 |
White |
4.55 ± 0.24 |
4.75 ± 0.03 |
4.96 ± 0.04 |
766.6 ± 1.83 |
0.55 ± 0.03 |
5.75 ± 0.24 |
|
F-6 |
White |
4.50 ± 0.24 |
4.50 ± 0.14 |
4.46 ± 0.30 |
783.4 ± 0.31 |
0.55 ± 0.03 |
4.70 ± 0.14 |
|
F-7 |
White |
4.55 ± 0.24 |
4.40 ± 0.21 |
4.50 ± 0.21 |
759.9 ± 0.63 |
0.62 ± 0.01 |
5.50 ± 0.28 |
|
F-8 |
White |
4.65 ± 0.03 |
4.30 ± 0.28 |
4.60 ± 0.14 |
771.7 ± 2.61 |
0.60 ± 0.00 |
6.90 ± 0.21 |
|
F-9 |
White |
4.75 ± 0.03 |
4.35 ± 0.17 |
4.95 ± 0.10 |
786.5 ± 2.51 |
0.61 ± 0.01 |
6.90 ± 0.14 |
|
F-10 |
White |
4.70 ± 0.07 |
4.20 ± 0.21 |
4.80 ± 0.16 |
848.7 ± 4.03 |
0.59 ± 0.01 |
5.10 ± 0.07 |
|
F-11 |
White |
4.70 ± 0.14 |
4.30 ± 0.07 |
4.72 ± 0.24 |
863.9 ± 3.46 |
0.45 ± 0.03 |
5.50 ± 0.28 |
|
F-12 |
White |
4.70 ± 0.14 |
4.20 ± 0.07 |
4.55 ± 0.24 |
883.6 ± 0.28 |
0.50 ± 0.00 |
5.75 ± 0.10 |
|
CT |
White |
4.50 ± 0.21 |
4.50 ± 0.21 |
4.45 ± 0.17 |
606.9 ± 2.75 |
0.50 ± 0.00 |
13.30 ± 0.14 |
|
RCT |
White |
3.85 ± 0.60 |
3.85 ± 0.60 |
4.56 ± 0.32 |
4.00 ± 2.80 |
0.40 ± 0.00 |
12.40 ± 0.21 |
F-1 to F-4, CT: lactose, F1-F6: Silicon dioxide (SiO2) F1-F6, CT: Maize starch
F-5 to F-8: Sorbitol F7-F12, CT: Talc. F7-F12: Sodium starch glycolate.
F-9 to F-12: MCC. CT: Conventional tablet (without non-volatile solvent)
In vitro release studies of liquisolid formulations and reference commercial tablet
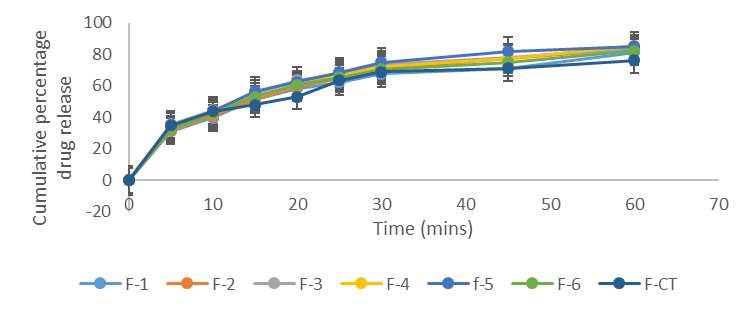
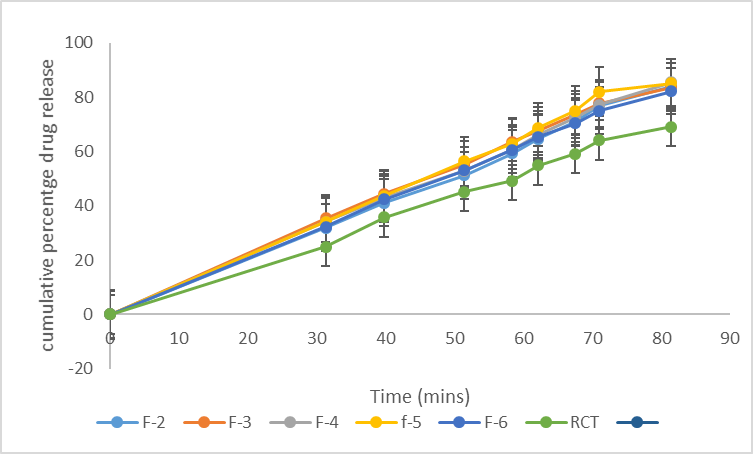
In vitro dissolution studies were carried out by USP type II method by using 0.1 N HCl as the dissolution medium. The studies were performed in all the formulations for 1 hour. The samples were taken at 5 minutes interval for first 30 minutes and 15 minutes interval for next 30 minutes and absorbance was measured in UV spectrophotometer at 252 nm. Two formulation parameters that normally affect the drug dissolution rate in immediate release liquisolid tablets were investigated. They include the effect of drug concentration in the liquid medication (ratio of drug and liquid vehicle) and effect of carrier/coating ratio (R-value). The results of the in vitro release studies of celecoxib from liquisolid formulation is shown in Table 6.
For celecoxib formulations, F-1, F-2, F-3, F-4, F-5 and F-6 formulated with lactose and sorbitol (F-5 and F-6) as carrier materials, silicon dioxide as a coating material and maize starch as a disintegrant recorded a release of 84.30 ± 0.00 %, 86.60 ± 1.20 %, 82.25 ± 1.44 %, 81.55 ± 0.95 %, 83.35 ± 0.17 % and 83.90 ± 0.56 % respectively, while formulations F-7, F-8, F-9, F-10, F-11 and F-12 formulated with talc as a coating material and sodium starch glycolate as a disintegrant recorded release at 81.65 ± 1.02, 83.30 ± 0.42%, 85.35 ± 0.74 %, 82.25 ± 0.31 %, 83.70 ± 0.42 % and 84.40 ± 0.91 % respectively. The conventional tablet (without the non-volatile solvent) recorded 77.45 ± 0.74 %. According to Nafiseh et al, (2022), the wettability of the liquisolid formulation is improved due to the presence of hydrophilic liquid vehicle, therefore more of the drug particles is exposed to the dissolution medium which subsequently leads to improved dissolution rate [34]. The dissolution rate of drugs in the dissolution medium depends on the contact area of the drug with the dissolution medium. At a constant rotational speed of the paddle at 50 rpm in combination with the dissolution medium, the thickness of the static diffusion layer and the diffusion coefficient of the drug molecules can be considered the same. According to Noye-Whitneys equation, increased solubility occurs with a decrease in drug particle size.
Table 6. In-vitro release profile of Celecoxib liquisolid formulations
|
Time (min) |
Dissolution medium |
F-1 |
F-2 |
F-3 |
F-4 |
F-5 |
F-6 |
F-7 |
F-8 |
F-9 |
F-10 |
F-11 |
F-12 |
RCT |
|
0 |
0.1 N HCl |
0 |
0 |
0 |
0 |
0 |
0 |
0 |
0 |
0 |
0 |
0 |
0 |
0 |
|
5 |
35.15 ± 0.24 |
33.90 ± 0.56 |
31.95 ± 2.01 |
29.58 ± 0.33 |
34.20 ± 0.63 |
33.91 ± 0.83 |
32.10 ± 2.12 |
32.45 ± 0.74 |
35.10 ± 0.28 |
33.00 ± 0.35 |
35.30 ± 0.14 |
34.10 ± 0.70 |
24.90 ± 0.21 |
|
|
10 |
48.85 ± 0.45 |
42.50 ± 1.69 |
41.85 ± 2.36 |
39.35 ± 0.60 |
41.25 ± 0.95 |
41.31 ± 0.99 |
39.20 ± 0.49 |
41.85 ± 0.53 |
45.70 ± 0.56 |
40.54 ± 0.39 |
43.20 ± 2.33 |
40.00 ± 0.70 |
36.30 ± 0.28 |
|
|
15 |
56.65 ± 0.31 |
53.00 ± 0.07 |
53.59 ± 2.47 |
54.24 ± 2.93 |
52.20 ± 0.07 |
52.53 ± 0.16 |
51.19 ± 0.78 |
54.10 ± 0.91 |
54.65 ± 1.09 |
52.35 ± 0.31 |
54.25 ± 1.37 |
52.60 ± 0.21 |
45.05 ± 0.24 |
|
|
20 |
0.1 N HCl |
63.80 ± 0.63 |
61.40 ± 0.63 |
60.40 ± 2.19 |
58.25 ± 0.67 |
57.25 ± 1.52 |
60.02 ± 0.44 |
58.35 ± 0.74 |
59.90 ± 0.28 |
63.20 ± 0.63 |
59.20 ± 0.21 |
61.75 ± 1.66 |
59.95 ± 0.38 |
48.85 ± 0.03 |
|
25 |
69.80 ± 0.21 |
68.80 ± 0.28 |
64.50 ± 2.54 |
62.30 ± 0.98 |
61.50 ± 0.91 |
64.66 ± 1.31 |
61.85 ± 0.67 |
65.05 ± 1.16 |
69.55 ± 0.24 |
62.72 ± 0.47 |
66.35 ± 2.51 |
65.60 ± 1.97 |
54.80 ± 0.21 |
|
|
30 |
74.70 ± 0.42 |
75.00 ± 0.21 |
69.90 ± 2.96 |
65.90 ± 0.14 |
68.45 ± 1.16 |
71.01 ± 0.64 |
67.90 ± 1.55 |
70.00 ± 0.42 |
75.30 ± 0.00 |
69.65 ± 0.17 |
72.70 ± 1.83 |
72.40 ± 1.62 |
58.85 ± 0.74 |
|
|
45 |
0.1 N HCl |
80.15 ± 0.03 |
82.50 ± 0.14 |
75.05 ± 3.57 |
72.60 ± 1.83 |
73.25 ± 0.24 |
76.27 ± 1.89 |
71.80 ± 1.27 |
75.80 ± 2.61 |
81.25 ± 0.74 |
72.25 ± 0.10 |
76.90 ± 2.33 |
78.15 ± 3.21 |
63.90 ± 0.21 |
|
60 |
84.30 ± 0.00 |
86.60 ± 1.20 |
82.25 ± 1.44 |
81.55 ± 0.95 |
83.35 ± 0.17 |
83.90 ± 0.56 |
81.65 ± 1.02 |
83.30 ± 0.42 |
85.35 ± 0.74 |
82.25 ± 0.31 |
83.70 ± 0.42 |
84.40 ± 0.91 |
68.50 ± 0.28 |
Carrier materials Coating materials Disintegrants
F-1 to F-4, CT: lactose, F1-F6: Silicon dioxide (SiO2) F1-F6, CT: Maize starch
F-5 to F-8: Sorbitol F7-F12, CT: Talc. F7-F12: Sodium starch glycolate.
F-9 to F-12: MCC. CT: Conventional tablet (without non-volatile solvent)
Figure 11. Drug release profile of batches F1 to F-6 and F-CT in 0.1 N HCl.
Figure 12. Drug release profile of batches F1 to F6 and R-CT in 0.1 N HCl
In vitro drug release kinetics of the liquisolid tablets
The in vitro drug release kinetics of the various formulations were investigated by using the various important mathematical models such as zero order (cumulative % drug release vs time), first order (log cumulative % drug release vs time), Higuchi matrix (cumulative % drug release vs square root of time), Korsmeyer-Peppas (log cumulative % drug release vs log time) and Hixson-Crowell. The release constants were calculated from the slopes of the respective plots. The release profile was interpreted and evaluated by the correlation coefficient (r2).
For the zero-order release kinetic model, the batch with the highest r2 value was batch F-10 with a value of 0.9353, while the lowest r2 value was recorded in batch F-1 with a value of 0.9153.
For the first order release kinetic model, the batch with the highest r2 value was 0.9986, was F-1, while the lowest r2 value was batch RCT with 0.9850.
For the Higuchi kinetic model, the batch with the highest r2 value was F-CT with 0.9671, while the lowest r2 value was recorded in batch F-5 with 0.9894.
For Korsmeyer-Peppas model, the formulation batch F-9 had the highest r2 value of 0.9995 and n-value of 0.407. According to Korsmeyer-Peppas, when 0.45 < n = 0.89, the release mechanism is non-Fickian transport, while when n > 0.89, the release mechanism is super-case II transport. When n < 0.5, the release mechanism is Fickian transport.
For the Hixson-Crowell, the highest r2 was recorded in batch F-2, with value of 0.9984, while the lowest r2 value was recorded in batch R-CT with value of 0.9731.
The liquisolid formulations exhibited best fit for Higuchi equation with r2 value greater than 0.95. Batch F-2 showed best fit for Hixson-Crowell model which is due to a relatively high drug release rate at initial phase followed by a phase in which the decrease of the release rate was more pronounced. Batch F-9 showed best fit for Korsemeyer-Peppas (0.9995) which is due to drug release by Fickian transport. Batch F-CT showed the highest correlation co-efficient (0.9671) in Higuchi model. It showed that the release of the drug involved both dissolution and diffusion [34]. For the zero-order model, batch F-10 showed the highest drug release which is independent of concentration.
Table 7. The Zero order, First order, Higuchi, Korsmeyer- Peppas and Hixson-Crowell models for the drug release of Celecoxib liquisolid formulations
|
Formulation batch |
Zero order |
First order |
Higuchi |
Korsmeyer-Peppas |
Hixson-Crowell |
|
|
|
r2 |
r2 |
r2 |
r2 |
n |
r2 |
|
|
|
|||||
|
F-1 |
0.9153 |
0.9986 |
0.9696 |
0.9962 |
0.439 |
0.9970 |
|
F-2 |
0.9336 |
0.9971 |
0.9783 |
0.9893 |
0.413 |
0.9984 |
|
F-3 |
0.9274 |
0.9960 |
0.9760 |
0.9918 |
0.480 |
0.9913 |
|
F-4 |
0.9295 |
0.9896 |
0.9752 |
0.9852 |
0.517 |
0.9832 |
|
F-5 |
0.9578 |
0.9936 |
0.9894 |
0.9883 |
0.395 |
0.9933 |
|
F-6 |
0.9413 |
0.9964 |
0.9824 |
0.9785 |
0.407 |
0.9950 |
|
F-7 |
0.9400 |
0.9925 |
0.9803 |
0.9869 |
0.463 |
0.9886 |
|
F-8 |
0.9338 |
0.9968 |
0.9795 |
0.9934 |
0.463 |
0.9932 |
|
F-9 |
0.9232 |
0.9984 |
0.9736 |
0.9995 |
0.388 |
0.9984 |
|
F-10 |
0.9353 |
0.9916 |
0.9775 |
0.9890 |
0.449 |
0.9944 |
|
F-11 |
0.9301 |
0.9962 |
0.9764 |
0.9826 |
0.398 |
0.9944 |
|
F-12 |
0.9373 |
0.9950 |
0.9790 |
0.9786 |
0.443 |
0.9948 |
|
F-CT |
0.9191 |
0.9950 |
0.9671 |
0.9889 |
0.313 |
0.9857 |
|
RCT |
0.9208 |
0.9850 |
0.9732 |
0.9965 |
0.459 |
0.9731 |
Formular development for optimized liquisolid tablet
The optimized formulation was selected based on the results obtained for dependent variables (in vitro drug release and drug content). From the results obtained, batch F-2 had the highest drug content of 97.4 ± 0.07 with percentage drug release of 86.60 ± 1.20
Table 8. Actual quantities for the optimization of the liquisolid tablets
|
Run (batch) |
Independent Factors |
Dependent factors |
||
|
Concentration of non-volatile solvent |
Carrier: coat ratio (R) |
Drug release (%) |
Drug content (%) |
|
|
1 |
100 |
5 |
84.70 ± 0.00 |
97.1 ± 1.59 |
|
2* |
100 |
5 |
86.60 ± 1.20 |
97.4 ± 0.07 |
|
3 |
100 |
5 |
82.25 ± 1.44 |
96.9 ± 0.38 |
|
4 |
200 |
5 |
81.55 ± 0.95 |
97.0 ± 0.15 |
|
5 |
200 |
5 |
83.35 ± 0.17 |
96.7 ± 0.42 |
|
6 |
200 |
5 |
83.90 ± 0.56 |
95.9 ± 0.65 |
|
7 |
300 |
5 |
81.65 ± 1.02 |
96.3 ± 0.31 |
|
8 |
300 |
5 |
83.30 ± 0.42 |
95.4 ± 0.65 |
|
9 |
300 |
5 |
85.35 ± 0.74 |
96.9 ± 0.58 |
|
10 |
400 |
5 |
82.25 ± 0.31 |
95.9 ± 0.40 |
|
11 |
400 |
5 |
83.70 ± 0.42 |
96.1 ± 0.90 |
|
12 |
400 |
5 |
84.40 ± 0.91 |
95.7 ± 0.74 |
Table 9. Formulation design of celecoxib liquisolid tablets
|
Formulation code |
Non-volatile liquid vehicle (mg) |
R |
Drug: liquid vehicle ratio |
Active ingredients (mg) |
Liquid vehicle (mg) |
Lf |
Carrier (mg) |
Coating material (mg) |
Starch (5 %) |
Mag. Stearate (1 % total weight, mg) |
Total weight (mg) |
|
F-2 |
PEG-400 |
5 |
|
100 |
|
0.46 |
434.8 |
87.5 |
33.77 |
6.754 |
675.4 |
|
CT |
---- |
---- |
---- |
100 |
---- |
---- |
425.7 |
85.1 |
30.54 |
6.108 |
610.8 |
R: Carrier and coating material ratio, Lf: Liquid load factor, Q; W/Lf (Q = carrier material and W: Total weight of drug and liquid vehicle), q = Q/R (q = coating material), CT: Conventional tablet without the non-volatile vehicle.
Carrier material Coating material Disintegrant
F-2, CT: lactose, F-2, CT: Silicon dioxide (SiO2) F-2, CT: Maize starch
Pre-compression studies of the optimized formulation
The angle of repose is a characteristic of the internal cohesion of the particles. If a powder is non-cohesive, the angle of repose will be high, but if a powder is cohesive, the angle of repose will be low [29]. The angle of repose of the optimized formulation was 22.10 ± 1.21, while that of the conventional tablet was 23.32 ± 0.35 without a significant difference (p < 0.05).
The bulk density of the optimized formulation was 0.21 ± 0.02, while that of the conventional tablet was 0.22 ± 0.01. The tapped density of the optimized formulation was 0.25 ± 0.01, while that of the conventional tablet was 0.34 ± 0.01. The Hausner ratio of the optimized formulation was 1.24 ± 0.03, while that of the conventional tablet was 1.14 ± 0.02. The Carrs index of the optimized formulation was 20.17 ± 1.40, while that of the conventional tablet was 18.00 ± 0.36. The drug content of the optimized formulation was 97.4 ± 0.07, while that of the conventional tablet was 95.7 ± 0.98, without a significant difference (p < 0.05).
Table 10. Precompression parameters of optimized liquisolid granules of Celecoxib (n =3, all values are written as Mean ± SD)
|
Pure drug/codes |
Angle of repose (o) |
Bulk density (g/ml) |
Tapped density (g/ml) |
Hausners Ratio |
Compressibility index (%) |
|
F-2 |
22.10 ± 1.21 |
0.25 ± 0.01 |
0.25 ± 0.01 |
1.14 ± 0.02 |
20.17± 1.40 |
|
CT |
23.32 ± 0.35 |
0.22 ± 0.01 |
0.34 ± 0.01 |
1.27 ± 0.04 |
18.00 ± 0.36 |
The general appearance of the tablets was white. The hardness of the optimized formulation was 4.90 ± 0.56, while that of the conventional tablet and the reference commercial tablet were 4.50 ± 0.21 and 4.85 ± 0.60 respectively. The thickness of the optimized formulation was 4.60 ± 0.21, while that of CT and RCT were 4.45 ± 0.21 and 3.80 ± 0.61 respectively. The diameter of the optimized formulation was 5.14 ± 0.28, while that of the CT and RCT were 4.45 ± 0.30 and 4.56 ± 0.31 respectively. The friability of the optimized formulation was 0.59 ± 0.08, while that of the CT and RCT were 0.45 ± 0.01 and 0.41 ± 0.01 respectively. The disintegration time of the optimized formulation was 5.02 ± 0.17, while that of the CT and RCT were 12.30 ± 0.14 and 12.38 ± 0.21 respectively.
Table 11. Post compression evaluation of the optimized formulation, conventional tablet and reference commercial tablet of Celecoxib (mean ± SD)
|
Formulation code |
General appearance |
Hardness (kg/cm2) |
Thickness (mm) |
Diameter (mm) |
Weight variation (mg) |
Friability (%) |
Disintegration time (sec) |
|
F-2 |
White |
4.90 ± 0.56 |
4.60 ± 0.21 |
5.15 ± 0.29 |
677.40± 1.62 |
0.59 ± 0.08 |
5.45 ± 0.17 |
|
CT |
White |
4.50 ± 0.21 |
4.50 ± 0.21 |
4.45 ± 0.17 |
606.90 ± 2.75 |
0.50 ± 0.00 |
13.30 ± 0.14 |
|
RCT |
White |
3.85 ± 0.60 |
3.85 ± 0.60 |
4.56 ± 0.32 |
600.70 ± 2.80 |
0.40 ± 0.00 |
12.40 ± 0.21 |
Carrier material Coating material Disintegrant
Lactose silicon dioxide maize starch
CT: Conventional tablet, R-CT: Reference commercial tablet.
In vitro release studies of the optimized formulation, conventional tablet and reference commercial tablet.
In vitro dissolution studies were carried out by USP type II method by using 0.1 N HCl as the dissolution medium. The studies were performed in all the formulations for 1 hour. The samples were taken at 5 minutes interval for first 30 minutes and 15 minutes interval for next 30 minutes and absorbance was measured in UV spectrophotometer at 354 nm. Two formulation parameters that normally affect the drug dissolution rate in immediate release liquisolid tablets were investigated. They include the effect of drug concentration in the liquid medication (ratio of drug and liquid vehicle) and effect of carrier/coating ratio (R-value). The results of the in vitro release studies of optimized formulation, conventional tablet and reference commercial tablet are shown in Table 15. At 1 hour 88.4 ± 1.20, 76.40 ±0.74, 65.60 ± 0.28 were released by the optimized formulation, conventional tablet and reference commercial tablet respectively.
Table 12. In-vitro release profile of the optimized formulation, conventional tablet and reference commercial tablet (mean ± SD)
|
Time (min) |
Dissolution medium |
F-3 |
F-CT |
RCT |
|
0 |
0.1 N HCl
|
0 |
0 |
0 |
|
5 |
34.2 ± 0.56 |
36.10 ± 0.42 |
24.90 ± 0.21 |
|
|
10 |
44.0 ± 1.69 |
46.85 ± 0.24 |
36.30 ± 0.28 |
|
|
15 |
56.0 ± 0.07 |
50.00 ± 0.01 |
45.05 ± 0.24 |
|
|
20 |
63.0 ± 0.63 |
56.95 ± 0.88 |
48.85 ± 0.03 |
|
|
25 |
69.0 ± 0.28 |
65.30 ± 0.14 |
54.80 ± 0.21 |
|
|
30 |
74.0 ± 0.21 |
68.50 ± 0.14 |
58.85 ± 0.74 |
|
|
45 |
83.0 ± 0.14 |
70.30 ± 0.41 |
62.90 ± 0.21 |
|
|
60 |
88.4 ± 1.20 |
76.40 ±0.74 |
65.60 ± 0.28 |
Figure 17. Cumulative percentage drug release of optimized batch (F-3), conventional tablet and reference commercial tablet
CONCLUSION
These findings from the in vitro release studies, suggested that the liquisolid technique is a promising approach for improving the bioavailability of poorly water-soluble drugs like celecoxib. The developed liquisolid compacts have the potential to enhance the therapeutic efficacy of celecoxib, and further in vivo studies are warranted to confirm these findings.
CONFLICT OF INTEREST
The authors declare no competing interests
REFERENCES
- Adibkia K, Shokri J, Barzegar-Jalali M, Solduzian M, Javadzadeh Y. (2014). Effect of solvent type on retardation properties of diltiazem HCl form liquisolid tablets. Colloids Surf B Biointerfaces. 113:10-14.
- Akinlade B, Elkordy AA, Essa EA, Elhagar S. (2010). Liquisolid systems to improve the dissolution of furosemide. Sci Pharm. 78(2):325-344.
- Amidon GL, Lennernäs H, Shah VP, Crison JR. (1995). A theoretical basis for a biopharmaceutic drug classification: the correlation of in vitro drug product dissolution and in vivo bioavailability. Pharm Res. 12(3):413-420.
- Badawy MA, Kamel AO, Sammour OA. (2016). Use of biorelevant media for assessment of a poorly soluble weakly basic drug in the form of liquisolid compacts: in vitro and in vivo study. Drug Deliv. 23(3):818-827.
- Chuahan PV, Patel HK, Patel BA, Patel KN, Patel PA. (2012). Liquisolid technique for enhancement of dissolution rate of ibuprofen. International Journal for Pharmaceutical Research Scholars. 1(1):268-280.
- Farheen F, Sharma G, Rathore A, Sharma N. (2015). Liquisolid technology: A review. World Journal of Pharmacy and Pharmaceutical Sciences. 2(3):947-958.
- Gulshan Md, Lakshmi Swapna Sai M, Rajesh J, Rama Rao N. (2016). A novel formulation of celecoxib in the treatment of familial adenomatous polyposis. Journal of Global Trends Pharm Sci. 7:3004-3008.
- Kaur M, Bala R, Arora S. (2013). Liquisolid technology: A review. International Journal of Advances in Pharmaceutical Sciences. 4(1):1-15.
- McCormack PL. (2011). Celecoxib: a review of its use for symptomatic relief in the treatment of osteoarthritis, rheumatoid arthritis and ankylosing spondylitis. Drugs. 71(18):2457-2589.
- Bettini R, Catellani PL, Santi P, Massimo G, Peppas NA, Colombo P. (2001). Translocation of drug particles in HPMC matrix gel layer: effect of drug solubility and influence on release rate. Journal of Controlled Release. 70(3):383-391.
- Dorozynski R, Jachowicz P, Kulinowaski S, Kwiecinski, Szybinski K, Skora T. (2004). The macromolecular polymers for the preparation of hydrodynamic ally balanced system-methods of evaluation. Drug Dev Int Pharm. 30(9):947-957.
- Hoffman A, Stepensky D, Lavy E, Eyal S, Klausner E, Friedman M. (2004). Pharmacokinetic and pharmacodynamic aspects of gastroretentive dosage forms. Int J Pharm. 277(1-2):141-153.
- National Institute for Health and Care Excellence (NICE). Non-steroidal anti-inflammatory drugs. Manchester: NICE; 2013. Available from: www.nice.org.uk (Accessed Sep, 2013).
- Sahil MG, Sharad SP, Shirish VS, Kisan RJ, Vilasrao JK. (2018). Liquisolid Compact: A New Technique for Enhancement of Drug Dissolution. International Journal of Research in Pharmacy and Chemistry. 3(1):705-715.
- Syed I, Pavani E. (2014). A Review on The Liquisolid Technique Based Drug Delivery System. International Journal of Pharmaceutical Sciences and Drug Research. 4(2):88-96.
- Beignon M, Bohic S, Le Guennec M, Le Goff D, Roger P, Proutire A. (1998). Molecular weight determination of macromolecules with a new simplified and coherent light scattering method. J Mol Struct. 443(1–3):233-253.
- ASTM_International. (2013). ASTM B213-13: standard test methods for flow rate of metal powders using the hall flowmeter funnel. ASTM_International, West Conshohocken, PA, USA.
- Utsav SP, Khushbu CP. (2018). Liquisolid Technique for Poorly Soluble Drugs. Journal of Science and Innovative Research. 2(1):145-159.
- Ankit B, Rathore RPS, Tanwar YS, Gupta S, Bhaduka G. (2013). Oral sustained release dosage form: an opportunity to prolong the release of drug. IJARPB. 3(1):7-14.
- Akinlade B, Elkordy AA, Essa EA, Elhagar S. (2010). Liquisolid systems to improve the dissolution of furosemide. Scientia pharmaceutica. 78(2):325-340.
- Asare-Addo K, Conway BR, Hajamohaideen MJ, Kaialy W, Nokhodchi A, Larhrib H. (2013). Aqueous and hydro-alcoholic media effects on polyols. Colloids Surfaces B Biointerfaces. 11(1):9-24.
- Alireza H, Fatemeh S, Ali N, Jaleh V, Hadi A. (2015). Preparation and characterization of celecoxib dispersions in Soluplus: comparison of spray drying and conventional methods. Iranian Journal of Pharmaceutical Research. 14(1):33-50.
- Armstrong NA. (2006). Tablet manufacture. In: Swarbrick J, Boylan JC, editors. Encyclopedia of pharmaceutical technology. 3rd ed. New York: Marcel Dekker.
- Gulshan Md, Lakshmi Swapna Sai M, Rajesh J, Rama Rao N. (2016). A novel formulation of celecoxib in the treatment of familial adenomatous polyposis. J Global Trends Pharm Sci. 7:3004-3008.
- Ning J, Shu M, Ming G, Jie F, Run C. (2011). Synthesis and characterization of cellulose-silica composite fiber in ethanol/water mixed solvents. Bioresources. pp. 1186-1195.
- Saravanan S, Dubey R. (2020). Synthesis of SiO2 nanoparticles by Sol-Gel method and their optical and structural properties. Romanian Journal of Information Science and Technology. 23(1):105-112.
- Abdullah A, Chalimah S, Primadone I, Hanantyo M. (2018). Physical and chemical properties of corn, cassava and potato starches. Earth and Environmental Science. 160:012-30.
- Haupt S, Zioni T, Gtai I, kleinstern J, Rubinstein A. (2006). Luminal delivery and dosing considerations of local celecoxib administration to colorectal cancer. Eur J Pharm Sci. 28:204-211.
- Koizumi T, Ritthidej GC, Phaechamud T. (2001). Mechanistic modeling of drug release from chitosan coated tablets. J Control Release. 70(3):277-284.
- Macheras P, Dokoumetzidis A. (2000). On the heterogeneity of drug dissolution and release. Pharm Res. 17(2):108-112.
- ASTM_International. (2014). ASTM F3049-14: Standard guide for characterizing properties of metal powders used for additive manufacturing processes. ASTM_International, West Conshohocken, PA, USA.
- National Institute for Health and Care Excellence (NICE). Non-steroidal anti-inflammatory drugs. Manchester: NICE; 2013. Available from: www.nice.org.uk (Accessed Sep, 2013).
- Nafiseh MN, Javad S, Nasimi N, Ali RZ, Matthew L, Yousef J. (2022). Combining liquisolid and co-grinding techniques to enhance the dissolution rate of celecoxib. Journal of Pharmaceutical Innovation. 4:1145-1156.
- Baveja SK, Ranga Rao KV, Padmalatha Devi K. (1987). Zero-order release hydrophilic matrix tablets of ?-adrenergic blockers. 39(1-2):39-45.
.png)
.png)
.png)
.png)
.png)