Previous Issues Volume 2, Issue 1 - 2017
The Rapid and Sensitive Hplc-Ms/Ms-Method of Determination of Mebeverine Metabolites in Human Plasma
Alexander Leonidovich Khokhlov1,2, Yuriy Aleksandrovich Dzhurko2 , Ilya Igorevich Yaichkov1,2*, Leonid Nikolaevich Shitov1,2, Anastasiya Mikhailovna Shitova2,3, Lidia Alexandrovna Khozova2 , Aleksey Evgenyevich Miroshnikov1
1State Budget-funded Educational Establishment of Higher Professional Education, Yaroslavl State Medical University of the Ministry of Health of the Russian Federation, Yaroslavl, Russia
2Quinta-Analytica Yaroslavl LLC, Yaroslavl, Russia.
3State Educational Establishment of Higher Professional Education, Yaroslavl State University named after P. G. Demidov of the Ministry of Education and Science of the Russian Federation, Yaroslavl, Russia.
Corresponding Author: Ilya Igorevich Yaichkov, 150043, Avtozavodskaya st, 29-97, Yaroslavl, Russian, Tel: 89109777498; E-Mail: [email protected]
Received Date: 10 Feb 2017 Accepted Date: 14 Feb 2017 Published Date: 27 Feb 2017
Copyright © 2017 Yaichkov II
Citation: Khokhlov AL, Dzhurko YA, Yaichkov II, Shitov LN, et al. (2017). The Rapid and Sensitive Hplc-Ms/Ms-Method of Determination of Mebeverine Metabolites in Human Plasma.Mathews J Pharm Sci. 2(1): 010.
ABSTRACT:
The rapid and sensitive method for quantifying mebeverine metabolites in human plasma was developed using HPLC-MS/ MS. Mebeverine acid-D5 and desmethyl mebeverine acid-D5 were used as internal standards. Sample preparation was performed by protein precipitation. The chromatographic separation was achieved on Phenomenex Luna C8 Mercury (20 x 4.0 mm, 5 μm) and Phenomenex Luna 5u C8 (150 x 4.6 mm, 5 μm) under gradient conditions of mobile phase. The calibration range of mebeverine acid and desmethyl mebeverine acid was 10 - 2000 ng/ml. The method was applied to conduct a pharmacokinetic study of 200 mg prolonged-release capsules Duspatalin on 24 healthy participants.
KEYWORDS:
HPLC-MS/MS; Mebeverine Acid; Desmethyl Mebeverine Acid; Pharmacokinetic.
INTRODUCTION:
Mebeverine is myotropic antispasmodic agent which effect is based on blockade of fast sodium channels and slow calcium channels on membrane of myocytes. It slows down depolarization of the membrane and prevents contraction of muscle fibers. The drug has high selectivity to smooth muscles of the gastrointestinal tract. Therefore it is primarily used to relieve spasms of organs of the digestive system [1].
Mebeverine being an ester is rapidly hydrolyzed in step of first-pass elimination by esterases to 3.4-dimethoxybenzoic (veratric) acid and mebeverine alcohol. The main metabolites of the drug are mebeverine acid (MA) and desmethyl mebeverine acid (DMA) (Figure 1) [2].
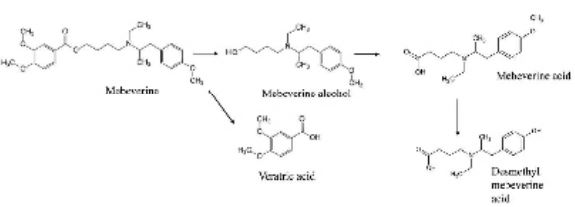
Figure 1: Metabolism of mebeverine.
The half-life of DMA after administration of prolonged-release capsules of mebeverine is 5-6 h, maximum concentration in blood (Cmax) after a single dose is 679 ng/ml, after repeated doses 804 ng/ml, time-to-peak concentration (Tmax) is about 2.92 hours [1, 3]. The area under the curve "concentrationtime" from last blood sampling procedure (AUC0-t) for DMA is 4552 ng.h/mL, the elimination constant is 0.147 [3]. The values of pharmacokinetic parameters for MA were not published. Therefore, obtaining new data about pharmacokinetic of me bevere in the form of prolonged-release capsule is actual. Several analytical methods of quantitative determination of mebeverine metabolites in plasma using HPLC and HPLC-MS/ MS were reported [2, 4]. However, these methods have some disadvantages, such as necessity of complex sample preparation, using solid-phase and liquid-liquid extraction, and lack of sensitivity (high LLOQ).
Therefore, the aim of this research is the development of a new rapid and sensitive bioanalytical method for determination of DMA and MA in human plasma by HPLC-MS/MS for evaluation of pharmacokinetic parameters of prolonged-release capsules of mebeverine ("Duspatalin").
MATERIAL AND METHODS:
Reference standards of mebeverine acid and desmethyl mebeverine acid were produced by Toronto Research Chemical's (USA), mebeverine acid-D5 (MA-D5) and desmethyl mebeverine acid-D5 (DMA-D5) were procured by TLC Pharmachem (Canada) (Figure 2).
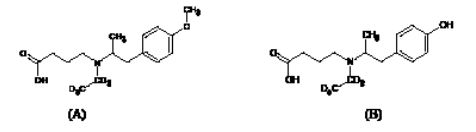
Figure 2: Structures of mebeverine acid-D5 (A) and desmethyl mebeverine acid-D5 (B).
HPLC grade acetonitrile and methanol were obtained from Merck (Darmstadt, Germany). Water was prepared with Direct Q3 UV water purification system. Solution of formic acid 85% and solution ammonium hydroxide 25% were produced by Panreac (Spain).
The HPLC-MS/MS system consists of two pumps Flux Instruments 2200 Rheos, autosampler CTC Analytics PAL HTS and triple quadrupole mass spectrometer "Thermo Scientific TSQ Quantum Ultra" equipped with HESI-II ion source.
The standard stock solutions of MA and DMA and solutions of internal standards of MA-D5 and DMA-D5 were prepared by dissolving accurately weighed substances in methanol. Working solutions were prepared by appropriate dilution of stock solutions in methanol. Calibration standards and quality control samples were prepared by adding 50 μl of the working solution of MA and DMA to 950 μl of blank plasma. There are eight calibration concentrations of MA and DMA: 10, 50, 200, 500, 750, 1000, 1500, 2000 ng/ml, six quality control samples: 10, 30 ng/ ml (LQC, low quality control), 400, 800 ng/ml (MQC, medium quality control), 1600, 2000 ng/ml (HQC, high quality control).
Analysis of plasma samples Protein precipitation was used for sample preparation: 400 μL of internal standard solution of MA-D5 and DMA-D5 was added to 100 μL of plasma sample. The mix was centrifuged at a speed of 2500 rpm for 10 min, and 5 μL of supernatant was injected into HPLC-MS/MS system.
The chromatographic separation was achieved on two analytical columns: Phenomenex Luna C8 Mercury (20 x 4.0 mm, 5 μm) (column No 1) and Phenomenex Luna 5u C8 (150x 4.6 mm, 5 μm) (column No 2). Elution was perfomed in gradient mode (table 1).
Table 1: Parameters of gradient elution
|
|
Pump 1 |
Pump 2 |
||||||||
|---|---|---|---|---|---|---|---|---|---|---|
|
Time (min) |
Flow rate (μl/min) |
A (%) |
B (%) |
C (%) |
D (%) |
Flow rate (μl/min) |
A (%) |
B (%) |
C (%) |
D (%) |
|
0,00 |
400 |
20 |
50 |
10 |
20 |
400 |
20 |
50 |
10 |
20 |
|
1,00 |
400 |
20 |
50 |
10 |
20 |
|||||
|
1,00 |
400 |
20 |
50 |
10 |
20 |
|||||
|
1,25 |
1200 |
60 |
30 |
10 |
0 |
|||||
|
3,75 |
1200 |
60 |
30 |
10 |
0 |
|||||
|
4,00 |
400 |
20 |
50 |
10 |
20 |
|||||
|
6,00 |
400 |
20 |
50 |
10 |
20 |
|||||
|
Solvents: A - acetonitrile, B - methanol, C - formic buffer solution 80 mM, D - water |
||||||||||
Flow of the mobile phase to 0.25 min from the column No 1 was directed to drain; from 0.25 min to 0.75 min the eluate from column No 1 directed to column No 2; 0.75 min until the end of the analysis the eluate from column No 1 was sent to drain, and the eluate from column No 2 was directed to mass spectrometer. The analysis was carried out at room temperature for 6 minutes.
Table 2: Parameters of mass spectrometry detection.
Detection was performed (Table 2) in negative ion mode, using the Heated-ESI ion source. An MRM transition of 280->121 m/z was selected for MA, 266.2?107 m/z for DMA, 285?121 m/z for MA-D5, 271?107 m/z for DMA-D5.
|
Parameter |
Value |
|---|---|
|
Spray voltage |
3000 V |
|
Capillary temperature |
200 °C |
|
Sheath gas |
40 arb. unit |
|
Sweep gas |
0 arb. unit |
|
Aux gas |
5 arb. unit |
|
Vaporazing temperature |
380 °C |
|
Collision gas pressure |
1,5 mTorr |
RESULTS AND DISCUSSION:
Validation was carried out in accordance with requirements of EMEA and FDA guidelines [5, 6]. Selectivity, linearity, lower limit of quantification, accuracy and precision, matrix effect, recovery, carryover effect, dilution integrity and stability were evaluated.
Selectivity was assessed by analyzing the blank plasma samples from independent sources. The chromatograms did not have any interference at the retention time of MA, DMA, MAD5 and DMA-D5 (Figure 3.)
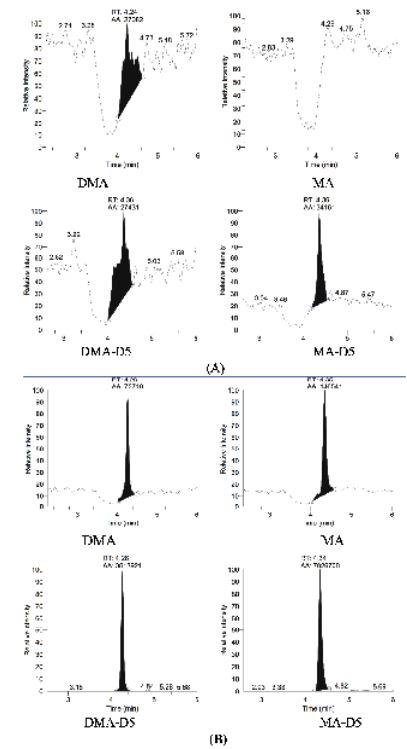
Figure 3: The chromatograms of blank plasma (A) and plasma with a lytes and internal standards (B).
The linearity was confirmed in the concentration range from 10 ng/ml to 2000 ng/ml for MA and DMA by measuring area ratio response ("analyte / internal standard"). The correlation coefficient of MA and DMA calibration curve was ranged from 0.9987 to 0.9999 and from 0.9965 to 0.9999, respectively. The ower limit of quantification (LLOQ) of both analytes was 10 ng/ml.
Intra- and inter-day accuracy and precision were determined by analysis of QC samples on six concentration levels. There were six replicates of every concentration (Table 3). The results meet the acceptance criteria: accuracy in the range from 80 to 120%, coefficient of variation (CV) less than 20% for LLOQ; accuracy in the range from 85 to 115%, coefficient of variation (CV) less than 15% for other concentrations. A twofold dilution of samples with concentrations of MA and DMA 3200 ng/ml did not affect accuracy: it was 112.23% for MA and 110.58% for DMA.
Table 3: Accuracy and precision for MA and DMA QC samples
|
Concentrarion (ng/ml) |
10 |
30 |
400 |
800 |
1600 |
2000 |
|---|---|---|---|---|---|---|
|
Mebeverine acid |
||||||
|
Intra-day accuracy and precision (batch 1) |
||||||
|
Mean (n=6) |
11.4 |
33.5 |
422.9 |
856.6 |
1 667.2 |
2 112.1 |
|
SD |
0.8 |
1.0 |
34.8 |
66.3 |
133.3 |
91.9 |
|
Precision (CV), % |
7.09 |
3.08 |
8.23 |
7.74 |
8.00 |
4.35 |
|
Acc., % |
114.18 |
111.71 |
105.72 |
107.08 |
104.20 |
105.61 |
|
Intra-day accuracy and precision (batch 2) |
||||||
|
Mean (n=6) |
8.5 |
31.7 |
455.5 |
883.3 |
1 807.3 |
2 255.8 |
|
SD |
0.6 |
0.7 |
20.1 |
14.6 |
30.9 |
62.5 |
|
Precision (CV), % |
7.10 |
2.19 |
4.41 |
1.65 |
1.71 |
2.77 |
|
Acc., % |
85.44 |
105.64 |
113.86 |
110.41 |
112.95 |
112.79 |
|
Intra-day accuracy and precision (batch 3) |
||||||
|
Mean (n=6) |
10.5 |
29.4 |
410.7 |
788.9 |
1 593.8 |
2 001.1 |
|
|
|
|
|
|
|
|
|
SD |
1.6 |
1.7 |
26.1 |
13.8 |
22.3 |
97.6 |
|
|
|
|
|
|
|
|
|
Precision (CV), % |
14.96 |
5.89 |
6.35 |
1.75 |
1.40 |
4.88 |
|
Acc., % |
104.57 |
98.08 |
102.68 |
98.62 |
99.61 |
100.05 |
|
Inter-day accuracy and precision |
||||||
|
Mean (n=18) |
10.1 |
31.6 |
429.7 |
843.0 |
1689.4 |
2123.0 |
|
SD |
1.6 |
2.1 |
32.5 |
55.5 |
118.1 |
134.0 |
|
|
|
|
|
|
|
|
|
Precision (CV), % |
15.75 |
6.55 |
7.55 |
6.59 |
6.99 |
6.31 |
|
Acc., % |
101.39 |
105.17 |
107.42 |
105.37 |
105.59 |
106.15 |
|
Desmethyl mebeverine acid |
||||||
|
Intra-day accuracy and precision (batch 1) |
||||||
|
Mean (n=6) |
11.9 |
33.2 |
400.4 |
818.1 |
1 575.3 |
2 031.3 |
|
SD |
0.6 |
1.5 |
27.6 |
61.8 |
135.2 |
64.1 |
|
Precision (CV), % |
5.00 |
4.39 |
6.89 |
7.56 |
8.58 |
3.15 |
|
Acc., % |
118.78 |
110.70 |
100.09 |
102.26 |
98.46 |
101.56 |
|
Intra-day accuracy and precision (batch 2) |
||||||
|
Mean (n=6) |
10.7 |
33.5 |
453.7 |
881.4 |
1 801.5 |
2 260.7 |
|
SD |
0.7 |
0.6 |
19.5 |
21.0 |
21.2 |
48.7 |
|
Precision (CV), % |
6.20 |
1.91 |
4.30 |
2.38 |
1.18 |
2.16 |
|
Acc., % |
107.01 |
111.63 |
113.43 |
110.17 |
112.59 |
9 113.04 |
|
Intra-day accuracy and precision (batch 3) |
||||||
|
Mean (n=6) |
9.9 |
32.7 |
448.8 |
894.7 |
1 820.3 |
2 249.3 |
|
SD |
0.6 |
1.8 |
22.0 |
22.2 |
46.0 |
89.1 |
|
Precision (CV), % |
5.88 |
5.35 |
4.91 |
2.48 |
2.53 |
3.96 |
|
Acc., % |
98.97 |
109.08 |
112.19 |
111.84 |
113.77 |
112.46 |
|
Inter-day accuracy and precision |
||||||
|
Mean (n=18) |
10.8 |
33.1 |
434.3 |
864.7 |
1732.4 |
2180.4 |
|
SD |
1.0 |
1.3 |
33.0 |
50.8 |
138.7 |
126.6 |
|
Precision (CV), % |
9.34 |
4.01 |
7.61 |
5.87 |
8.01 |
5.81 |
|
Acc., % |
108.22 |
110.48 |
108.57 |
108.09 |
108.27 |
7109.02 |
There was no carry-over in blank plasma samples folowing the injection of ULOQ sample. Therefore, injection of blank plasma between runs is not necessary. The recovery rate was 91.48% for MA and 91.98% for DMA at low concentration level (30 ng/ ml), and 88.03% for MA and 86.76% for DMA at high concentration level (1600 ng/ml). Matrix effect was evaluated by comparing the mean area ratio of plasma sample with mean area ratio of methanol solutions of MA and DMA. The normalized matrix factor (NMF) values were calculated (Table 4). The results were acceptable: coefficient of variation (CV) was less than 15%.
Table 4: Matrix effect evaluation.
|
|
Mebeverine acid |
Desmethyl mebeverine acid |
||
|---|---|---|---|---|
|
Concentrarion (ng/ml) |
30 |
1600 |
30 |
1600 |
|
NMF |
1.053 |
1.063 |
1.127 |
1.060 |
|
CV, % |
2.24 |
3.23 |
2.95 |
2.89 |
The evaluation of stability of MA and DMA at human plasma was performed at concentrations of 30 ng/ml and 1600 ng/ ml with six replicates of each levels. Short-term, long-term, freeze and thaw stability was studied. The results are represented in the results of all validation tests correspond to acceptance criteria. Table 5.
Table 5: Stability study of MA and DMA at plasma
|
|
Short-term stability (24 h.) |
Long-term stability |
Freeze and thaw stability (3 cycles) |
|
|---|---|---|---|---|
|
28 days |
98 days |
|||
|
Mebeverine acid |
||||
|
30 ng/ml |
||||
|
Mean (n=6) |
32.3 |
34.0 |
33.6 |
33.7 |
|
CV, % |
2.87 |
1.13 |
3.54 |
2.09 |
|
Acc., % |
107.73 |
113.23 |
112.13 |
112.34 |
|
1600 ng/ml |
||||
|
Mean (n=6) |
1 564.9 |
1 687.3 |
1 657.0 |
1 772.6 |
|
CV. % |
3.08 |
2.50 |
6.00 |
10.57 |
|
Acc., % |
97.81 |
105.45 |
103.56 |
110.79 |
|
Desmethyl mebeverine acid |
||||
|
30 ng/ml |
||||
|
Mean (n=6) |
33.4 |
33.9 |
34.1 |
33.3 |
|
|
|
|
|
|
|
CV. % |
3.86 |
3.77 |
4.21 |
6.28 |
|
|
|
|
|
|
|
Acc., % |
111.41 |
113.07 |
113.61 |
110.98 |
|
1600 ng/ml |
||||
|
Mean (n=18) |
1 526.7 |
1 765.2 |
1 761.0 |
1 839.7 |
|
CV, % |
3.22 |
0.91 |
4.89 |
13.49 |
|
Acc., % |
95.42 |
110.33 |
110.06 |
114.98 |
The Pharmacokinetic Study The study of pharmacokinetic of capsules "Duspatalin" was conducted in accordance with requirements of guidances of FDA, EMEA and ethical principles of the Declaration of Helsinki [7, 8].
Population for evaluation of pharmacokinetic parameters included 24 volunteers in the age from 18 to 45 years. This group consisted of 13 women and 11 men. All the participants were of the Caucasian race, selected according to the criteria of inclusion and non-inclusion. The mean age of subjects was 25.8 ± 7.1 years, height 171.5 ± 9.4 cm, weight 68.1 ± 10.5 kg, BMI 23.3 ± 2.8 kg/m2.
Blood samples were collected pre-dose and post-dose at 0.5; 1; 1.5; 2; 2.5; 3; 3.5; 4; 5; 6; 8; 10; 12; 24 h after the administration of capsules into K3 EDTA vacuum centrifuge tubes [9-11]. The tubes were centrifuged at 2500 rpm for 10 min. The obtained plasma was immediately frozen at -20o C until assay.Due to rapid first-pass elimination of the drug concentrations of two main metabolites: mebeverine acid and desmethyl mebeverine acid were determined. The test product was "Duspatalin" 200 mg prolonged-release capsules from Abbott Healthcare SAS, France (batch number: 10215, expiry date: 04.2017).
Statistical analysis of the results was performed by using software package Rbv. 3.2.1, Module Bear (Lee, Hsin-yaand Lee, Yung-jin (2014) bear: Data Analysis Tool for Average Bioequivalence and Bioavailability, R package version 2.6.4) and StatSoft STATISTICA v.12.
The following pharmacokinetic parameters were calculated:
-
Maximum measured plasma concentration (Cmax);
-
Time-to-peak concentration (Tmax);
-
Area under the pharmacokinetic "concentration - time" curve from zero to the last blood sampling procedure (AUC0-t);
-
Area under the pharmacokinetic curve from time zero to infinity (AUC0-8);
-
Relative absorption rate (Cmax/AUC0-t);
-
Ratio of the AUC0-t to the AUC0-8;
-
Terminal elimination rate constant (Kel);
-
Half-Life elimination of the drug (T½)
-
mean resident time (MRT)
Table 6: Pharmacokinetic parameters of metabolites of mebeverine
|
Mebeverine acid |
||||||||||
|---|---|---|---|---|---|---|---|---|---|---|
|
Cmax, ng/ml |
Tmax, h |
AUC0-t, ng.h/ml |
AUC0-8, ng.h/ml |
AUC0-t /AUC0- 8, % |
Cmax/AUC0-t, h-1 |
Kel, h-1 |
?1/2, h |
MRT, h |
|
|
|
Mean |
62.52 ± 35.01 |
3.27±1.03 |
293.94±151.78 |
365.85±140.49 |
82.34±11.61 |
0.2238±0.0598 |
0.27584±0.08426 |
2.87±1.39 |
5.82±1.57 |
|
|
Min |
22.3 |
1.5 |
54.03 |
110.01 |
|
47.43 |
0.1649 |
0.08683 |
1.61 |
4.27 |
|
Max |
173.5 |
5 |
601.03 |
649.49 |
96.04 |
0.4128 |
0.43138 |
7.98 |
11.45 |
|
|
CV, % |
56.00 |
31.55 |
51.64 |
38.40 |
14.10 |
26.72 |
30.55 |
48.38 |
26.91 |
|
|
Desmethyl mebeverine acid |
|
|||||||||
|
Cmax, ng/ml |
Tmax, h |
AUC0-t, ng.h/ml |
AUC0-8, ng.h/ml |
AUC0-t /AUC0- 8, % |
Cmax/AUC0-t, h-1 |
Kel, h-1 |
T1/2, h |
MRT, h |
|
|
|
Mean ±SD |
291.81 ± 125.92 |
3.19±1.48 |
2191.85±542.94 |
2551.74±546.96 |
86.26±11.62 |
0.1339±0.0497 |
0.11605±0.06657 |
7.52±3.31 |
11.2±4.25 |
|
|
Min |
114.6 |
1.5 |
1081.45 |
1388.65 |
40.34 |
0.0838 |
0.04631 |
2.33 |
5.34 |
|
|
Max |
607.4 |
8 |
3262.43 |
3547.35 |
95.84 |
0.2969 |
0.29771 |
14.97 |
22.49 |
|
|
CV, % |
43.15 |
46.44 |
24.77 |
21.43 |
13.47 |
37.15 |
57.36 |
44.04 |
37.97 |
|
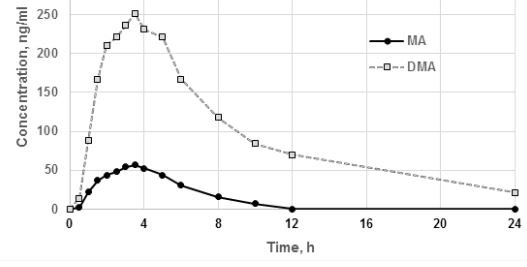
Figure 4: Averaged pharmacokinetic profiles of MA and DMA plasma concentrations after a single dose of Duspatalin 200 mg.
The average value of the ratio of AUC0-t / AUC0-8 for MA was 88.51%, for DMA was 86.26%, which indicates that duration of observation is sufficient. The mean values of maximum concentrations of MA and DMA in plasma of volunteers were 62.52 ± 35.01 and 291.81 ± 125.92 ng / ml, respectively, value of AUC0-t ± 293.94 ± 151.78 and 2191.85 ± 542.94 ng.h / mL, respectively, the mean value of Tmax - 3.27 ± 1.03 and 3.19 ± 1.48 h, respectively. Thus, the time-to-peak concentration of both metabolites was practically equal, while the maximum plasma concentration, AUC0-t of DMA was significantly higher than MA. This may indicate that most of MA immediately after oxidation of mebeverine alcohol exposed to demethylation. The calculated pharmacokinetic parameters of DMA significantly differ from previously published studies (Table 7) [1, 3].
Table 7: The comparison of the obtained values of pharmacokinetic parameters of DMA with the published data [1, 3].
|
Pharmacokinetic parameters |
Obtained value |
Published value |
|---|---|---|
|
Cmax, ng/ml |
291.81±125.92 |
679 |
|
Tmax, h |
3.19±1.48 |
2.92 |
|
AUC0-t, ng.h/ml |
2191.85±542.94 |
4553 |
|
AUC0-∞, ng.h/ml |
2551.74±546.96 |
4863 |
|
Kel |
0.11605±0.06657 |
0.147 |
|
T1/2, h |
7.52±3.31 |
4.91 |
Thus obtained mean values Cmax, AUC0-t, AUC0- ∞ are approximately 2 times lower, and measured half-life is 2 hours longer than in published data. It may be associated with high level of intersubject variability and influence of situational factors on the process of hydrolysis of the drug on first-pass stage.
SUMMARY:
The new rapid and sensitive HPLC-MS/MS-method of quantitative determination of mebeverine metabolites in human plasma has been developed and validated. LLOQ of MA and DMA was 10 ng/ml. The run time was 6 min. As a result of the study the new data about pharmacokinetic parameters of MA and DMA after administration of prolonged-release mebeverine capsules 200 mg were obtained, which can be used for the design of bioequivalence studies.
REFERENCES: