Previous Issues Volume 3, Issue 1 - 2018
Patients with a Diagnosis of Malignant Cancer First After Tia/Stroke Usually Appear to Have Lower Annual Risk of Stroke/Myocardial Infarction Events Compared to Patients Without Cancer Diagnosis. A 25-Year Follow-Up Hospital-Based Observational Study
Sven-Erik Eriksson
Division of Neurology, Department of Medicine, Falun Hospital, S-791 82 Falun, Sweden
Corresponding Author: Sven-Erik Eriksson, Division of Neurology, Department of Medicine, Falun Hospital, S-791 82 Falun, Sweden, Tel: +46 70-5717116; E-Mail: [email protected]
Received Date: 15 Mar 2018 Accepted Date: 20 Mar 2018 Published Date: 22 Mar 2018 Copyright © 2018 Sven-Erik E
Citation: Sven-Erik E. (2018). Patients with a Diagnosis of Malignant Cancer First After Tia/Stroke Usually Appear to Have Lower Annual Risk of Stroke/Myocardial Infarction Events Compared to Patients Without Cancer Diagnosis. A 25-Year Follow-Up Hospital-Based Observational Study. Mathews J Neurol. 3(1): 010.
ABSTRACT
Background and aim: To assess whether transient ischaemic attacks (TIA)/stroke patients with a diagnosis of malignant cancer at any time of life had different prognoses regarding annual risk of stroke/myocardial infarction (MI) or survival compared to TIA/stroke patients without cancer.
Material and methods: A retrospective study of transient ischaemic attacks (TIA)/stroke patients hospitalized in the Stroke Unit or in the Department of Neurology, Linkoping, in 1986 and followed up to Feb. 2011.
Results: In total, 67 of 288 men (23%) had 78 cancers, and 69 of 261 women (26%) had 72 cancers. The type of cancer, past cancer or not, and patient sex were each important factors in the annual risk of stroke or MI. New stroke was a statistically significantly more common cause of death in the group of male patients who did not have a malignant cancer (p=.004), as was fatal MI in women (p=.016). There were no statistically significant differences in survival in men or women with cancer vs. without cancer.
Conclusion: This study provides support for the assumption that cancer itself and/or its treatment may have impact on stroke/myocardial infarction events in patients with TIA/stroke.
KEYWORDS
Cancer; Myocardial Infarction; Recurrent Stroke; Survival.
INTRODUCTION
Cancer can increase the risk of stroke due to multiple causes [1], especially during the first 3-6 months after diagnosis for lung, pancreatic, colorectal, breast, prostate cancers [2, 3], or with diagnosed cancer in the nervous system or leukaemia [3]. The occurrence of metastasis is associated with an increased risk of haemorrhagic/ischaemic stroke [3]. In patients with cancer in the nervous system, colon, rectum, urinary bladder or leukaemia, an increased risk of ischemic stroke has been found even during long-term observation [3], as for women with breast cancer [3-6]. Radiotherapy has been reported to be a risk factor for stroke [5] as well as for myocardial infarction (MI) [7], whereas treatment with tamoxifen has been reported to increase the risk of stroke [6], but to decrease the risk of MI [8].
Charturwedi et al. [9] declared that the identified ischaemic strokes among cancer patients were low and that the rate of recurrent ischaemic events, which occurred in 6% of cancer patients during a mean observation of 9 months, was not higher than the results from different stroke studies reported. However, in a Chinese stroke study [10], past cancer was shown by Cox regression analysis to be a predictor of recurrent stroke as well as cardiovascular mortality during longterm follow-up. The main purposes of this retrospective study were to determine whether patients admitted due to transient ischaemic attack (TIA) or different subgroups of stroke with a diagnosis of malignant cancer (International Classification of Disease (ICD), ICD-10: C00-C97) either before and/or after admission had different risks of recurrent stroke and MI annually compared to patients without cancer.
MATERIALS AND METHODS
This study consists of a cohort of 549 patients who had been hospitalized in the Stroke Unit or on the general ward of the Department of Neurology, University Hospital Linkoping in 1986 and retro/prospectively followed up until Feb. 2011 [11]. The definitions of risk factors have been reported previously [11, 12]. Cause of death was based on the underlying cause, defined by the World Health Organization (WHO) as the disorder that began the chain of events leading to death. Data about types of cancer were obtained from the Swedish Cancer Registry established in 1958 and with data to 2010, with permission from the National Board of Health and Welfare, Stockholm, Sweden as well from journals and autopsy reports. Patients with basal cell carcinoma were not included in this report because basal cell carcinoma was not included in the Swedish Cancer Registry until 2004. Stage of cancer or cancer treatment was not reported.
STATISTICAL ANALYSIS
Statistical analysis was performed using the x2 -test and Fisher's exact test. The Kaplan-Meier life table technique was used to estimate the surviving proportion, and the log rank test was used to analyse the differences in survival between cancer and non-cancer patients.
RESULTS
Baseline characteristics of patients with a cancer diagnosis either before or after admission vs. patients without cancer are shown in Table 1. A total of 288 men were followed up for 2254 years ( cancer group, mean 8.6 years; non-cancer group, mean 7.6 yrs) and 261 women for 1984 years (cancer group, mean 8.5 yrs; non- cancer group, mean 7.3 yrs). Within 3 years after admission, fifteen men (5.2%) and eleven women (4.2%) had been diagnosed with various types of cancer. In total, 78 cancers were diagnosed in 67 men vs. 72 cancers in 69 women. (Figure. 1) Men had more cancers after admission than women did (p=.027).
Table 1: Baseline characteristics in a cohort of patients with cancer(s) (ICD-10, C00-C92) diagnosed before and/or during the observation time (including autopsies) vs. patients without cancer
| Men | Women | |||||
|---|---|---|---|---|---|---|
| Cancer1N=67a | Non-cancer n=221 | p-value | Cancer1n=69b | Non-cancer n=192 | p-value | |
| Age (mean, median(SD), yrs | 68.4, 68(10) | 70.1, 72(10.7) | ns | 70.6, 74(11.9) | 72.7, 74(11.5) | ns |
| Diagnosis, % Transient ischaemic attack (TIA) Atherosclerotic cerebral infarction (ACI) Cardioembolic cerebral infarction (CE) Lacunar infarction (LI) Intracerebral haemorrhage (ICH) | 9 58.2 6 16.4 10.4 | 12.7 51.1 16.7 10.9 8.6 | ns | 4.3 60.9 14.5 8.7 11.6 | 7.3 52.6 22.9 8.9 8.3 | ns |
| Severity, % TIA Minor stroke Moderate stroke Major stroke | 9 52.2 14.9 23.9 | 12.7 34.8 19.9 32.6 | ns | 4.3 49.2 17.4 29 | 7.3 36.5 16.7 39.1 | ns |
| Treatment with antihypertensive drugs during hospitalization, % | 43.3 | 57.5 | .05 | 69.6 | 63.5 | ns |
| Hypertension or treatment with antihypertensive drugs during hospitalization,% | 58.2 | 68.3 | ns | 72.5 | 78.1 | ns |
| Fasting blood glucose= 6.1 mmol/L or history of diabetes, % | 32.8 | 39.4 | ns | 39.1 | 50.5 | ns |
| Fasting blood glucose, mean (SD) Missing, % | 6.7(3.5) 10.4 | 6.3(2.6) 6.3 | ns | 6.9(3) 14.5 | 7(3.1) 7.3 | ns |
| History of diabetes, % | 16.4 | 18.6 | ns | 23.2 | 19.3 | ns |
| History of myocardial infarction or pathological Q waves on ECG, % | 28.4 | 24.9 | ns | 17.4 | 16.7 | ns |
| Heart failure, % | 25.4 | 32.1 | ns | 40.6 | 39.6 | ns |
| Fasting S-cholesterol, % <5 mmol/L 5-6.4 mmol/L =6.5 mmol/L Missing,% | 22.2 52.8 25 46.3 | 17 39.8 43.7 60.2 | ns | 10 50 40 56.5 | 15.2 40.9 43.9 65.6 | ns |
| Fasting S-cholesterol, mean(SD) | 1.7(0.9) | 1.8(1.2) | ns | 1.7(1) | 1.6(0.8) | ns |
| AF on ECG, % Missing, % | 6 7.5 | 18.6 6.3 | .012 | 23.6 20.3 | 24.6 6.8 | ns |
| Previous stroke, % | 22.4 | 31.7 | ns | 18.8 | 23.4 | ns |
| CT-scan, n Visible infarction, % No One Multiple Visible LI Leukoaraiosis | n=46 43.5 26.1 30.4 28.3 13 | n=149 29.5 36.9 33.6 24.2 22.8 | ns ns ns | n=43 39.5 37.2 23.2 18.6 16.3 | n=115 34.7 43.5 21.7 22.6 24.3 | ns ns ns |
1Except basal cell carcinoma, 2 cases aCancer before admission (mean age, median(SD),yrs), n=17 (73.9, 73(11); cancer after admission, n=46 (65.8, 66(8.6); cancer both before and after admission, n=4 (74.5, 75.5(9.9) b Cancer before admission (mean age, median(SD),yrs), n=38 (70.6, 74.5(12.6); cancer after admission, n=30 (70.5, 72(11.4); cancer both before and after admission, n=1 (76)
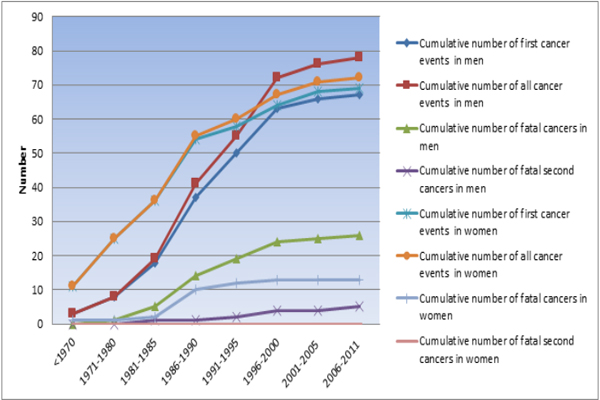
Figure 1: Cumulative number of cancers according to year of diagnosis and first, all and fatal cancers.
Among men, 32.8% in the cancer group had a recurrent stroke, compared to 48.9% in the non-cancer group (p=.025); the corresponding values for women were 46.4% and 47.4%, respectively. Among male cancer patients with atrial fibrillation (AF) at admission or during follow-up, recurrent stroke occurred in seven cases (36.8%) compared with 43 cases (54.4%) in men without cancer. The corresponding values for women were eleven cases (55%) and 35 cases (53%). Fifteen patients (22.4%) had a MI in the male cancer group, compared to thirteen in the female cancer group (18.8%). In the noncancer groups, these figures were 29% and 26%, respectively. Men with past cancer had an increased annual risk of nonfatal stroke and fatal MI, whereas women had an increased annual risk of fatal stroke compared to non-cancer patients. In contrast, in patients first diagnosed with cancer after admission, the risks of stroke and MI (nonfatal and fatal) per year were lower compared to the risks for non-cancer patients (Table 2, 3).
Table 2: Stroke, myocardial infarction events reported annually in patients with cancer, in total as subdivided by cancer diagnosis before admission, during follow-up, or both.
| Men | Women | ||||||||
|---|---|---|---|---|---|---|---|---|---|
| Observation time | Cancer before admission,39.2 yrs | Cancer after admission, 513 yrs. | Cancer both before and after admission, 25.1 yrs. | Total 577.3 yrs. | Cancer before admission,241.9 yrs. | Cancer after admission, 336.9 yrs. | Cancer both before and after admission,8.7 yrs. | Total, 587.6 yrs. | |
| Stroke, n Annually (%/year) | 5 12.7 | 25 4.9 | 0 | 30 5.2 | 22 9.1 | 30 8.9 | 0 | 52 8.8 | |
| Lethal stroke, n Annually (%/year) | 1 2.5 | 4 0.8 | 0 | 5 0.9 | 12 5 | 2 0.6 | 0 | 14 2.4 | |
| MI, n Annually (%/year) | 2 5.1 | 19 3.7 | 1 4 | 22 3.8 | 9 3.7 | 4 1.2 | 1 11.5 | 14 2.4 | |
| Lethal MI, n Annually (%/year) | 1 2.5 | 5 1 | 1 4 | 7 1.2 | 3 1.2 | 1 0.3 | 0 | 4 0.7 | |
Table 3: The cumulative risk of all (fatal) strokes/myocardial infarctions per 100 patient-years in men and women with and without cancer reported as totals and over different observation intervals.
| Men Stroke | Men Fatal recurrent stroke | Men MI | Men Fatal MI | Women Stroke | Women Fatal recurrent stroke | Women MI | Women Fatal MI | |||||||||
|---|---|---|---|---|---|---|---|---|---|---|---|---|---|---|---|---|
| Cancer | Non-cancer | Cancer | Non-cancer | Cancer | Non-cancer | Cancer | Non-cancer | Cancer | Non-cancer | Cancer | Non-cancer | Cancer | Non-cancer | Cancer | Non-cancer | |
| 0-1 y, n | 6 | 26 | 1 | 7 | 2 | 14 | 1 | 6 | 10 | 36 | 4 | 14 | 4 | 17 | 1 | 6 |
| Annually, (%/year) | 157.9 | 282.3 | 32.5 | 76 | 64.9 | 152 | 32.5 | 65.1 | 400 | 322.6 | 160 | 125.4 | 160 | 152.3 | 40 | 53.8 |
| 0-5 yrs, n | 15 | 92 | 1 | 26 | 9 | 47 | 4 | 18 | 31 | 85 | 9 | 32 | 8 | 33 | 3 | 15 |
| Annually, (%/year) | 32.5 | 51.1 | 2.2 | 14.4 | 19.5 | 26.1 | 8.7 | 10 | 47.6 | 61.1 | 13.8 | 23 | 12.3 | 23.7 | 4.6 | 10. 8 |
| 0-10 yrs., n | 21 | 134 | 1 | 41 | 19 | 69 | 6 | 22 | 42 | 113 | 13 | 46 | 11 | 52 | 4 | 25 |
| Annually, (%/year) | 15 | 26.4 | 0.7 | 8.1 | 13.5 | 13.6 | 4.3 | 4.3 | 27.4 | 26.4 | 8.5 | 10.8 | 7.2 | 12.2 | 2.6 | 5.8 |
| 0-15 yrs, n | 27 | 156 | 5 | 47 | 21 | 83 | 6 | 31 | 46 | 125 | 13 | 50 | 12 | 67 | 4 | 31/th> |
| Annually, (%/year) | 8.7 | 18 | 1.6 | 5.4 | 6.8 | 9.6 | 1.9 | 3.6 | 19.5 | 18.6 | 5.5 | 7.5 | 5.1 | 10.1 | 1.7 | 4.7 |
| 0-20 y, n | 29 | 162 | 5 | 49 | 21 | 98 | 6 | 34 | 50 | 133 | 14 | 51 | 13 | 71 | 4 | 33 |
| Annually, (%/year) | 6.8 | 15 | 1.2 | 4.5 | 4.9 | 9.1 | 1.4 | 3.2 | 14.5 | 17.2 | 4.1 | 6.6 | 3. 8 | 9.2 | 1.5 | 4.3 |
| Total, n | 30 | 169 | 5 | 50 | 22 | 103 | 7 | 35 | 52 | 135 | 14 | 52 | 14 | 74 | 4 | 34 |
| Annually, (%/year) | 5.2 | 10.1 | 0.9 | 3 | 3.8 | 6.1 | 1.2 | 2.1 | 8.8 | 9.7 | 2.4 | 3.7 | 2.4 | 5.3 | 0.7 | 2.4 |
There were no statistically significant differences in survival between cancer and non-cancer patients according to the log rank test (Table 4).The time of cancer diagnosis (before or after admission) did not influence the percentage of surviving women at the end of the observation period (13.2% vs. 13.3%), and the mean age at admission for both groups was 70.5 years. For men with past cancer: no survivors, mean age at admission 73.9 years old. For men with cancer after admission: 6.5% survival; mean age at admission 65.8 years. Fatal cancer occurred in 26 men (38.8%) (known cancer before admission in six cases) vs. thirteen women (19.4%) (known before admission in three cases) (p=.013). In men, the mortality rate due to cancer diagnosed after admission was 35.7%, compared to 31.3% in women. Cardiovascular death occurred in 56.3% of men with cancer diagnosed before admission compared to 78.8% of women.
Table 4: Kaplan-Meier estimates of probabilities of survival in a cohort of patients with/without cancer, 1986-2011. Figures in parentheses indicate 95% confidence intervals
| Survival in each subgroup and gender, % | |||||
|---|---|---|---|---|---|
| Time after admission | Cancer, n=67 M | Non-cancer, n=221 M | Cancer, n=69 F | Non-cancer n=192 F | |
| 1 month | 93 (86-99) | 86 (81-91) | 91 (85-98) | 87 (83-92) | |
| 3 months | 91 (84-98 | 83 (78-88) | 90 (83-97) | 81 (75-86) | |
| 6 months | 90 (82-97 | 82 (77-87) | 86 (77-94) | 78 (72-84) | |
| 1 year | 84 (75-92) | 77 (72-83) | 83 (74-92) | 73 (67-80) | |
| 2 years | 76 (66-86) | 72 (66-77) | 75 (65-86) | 66 (59-72) | |
| 5 years | 60 (48-72) | 51 (45-58) | 52 (40-64) | 49 (42-56) | |
| 10 years | 40 (31-52) | 30 (24-36) | 33 (22-45) | 27 (21-33) | |
| 15 years | 19 (10-29) | 17 (12-22) | 23 (13-33) | 17 (11-21) | |
| 20 years | 9 (2-16) | 11 (7-15) | 15 (6-23) | 414 (9-18) | |
| Total | 5 (0-9) | 7 (4-11) | 13 (5-21) | 9 (5-13) | |
New stroke was a statistically significantly more common cause of death in the group of male patients who did not have a malignant cancer (p=.004), as was fatal MI in women (p=.016). Nonvascular causes of death were significantly higher in both cancer groups (p=.000). The distributions of different causes of death during different observation periods and in total are shown in Figure 2. Table 5 summarizes the risk of any stroke/myocardial infarction and the risk of strokes/myocardial infarctions and causes of death per 100 patient-years for several cancer types.
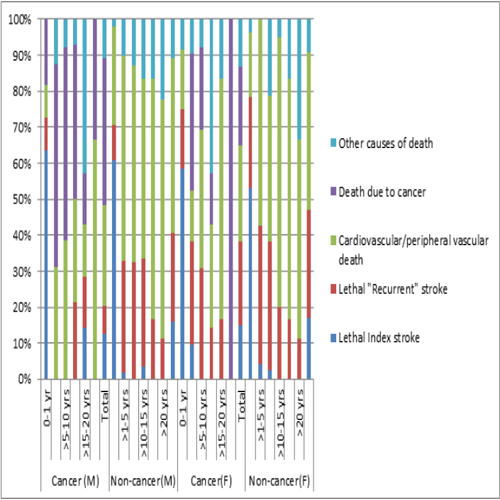
Figure 2: Causes of death during different intervals in men (cancer, n=64; non-cancer, n=205), women (cancer n=60, non-cancer, n=175), and in total.
Table 5: Risk for stroke/myocardial infarction and risk of strokes/myocardial infarctions and causes of death per 100 patient-years in different cancer types.
| Men | Death | ||||||||||
|---|---|---|---|---|---|---|---|---|---|---|---|
| Number of patients | Observation time, (yrs.) | Stroke n % | Stroke Total Annually (%/year) | MI n % | MI Total Annually (%/year) | Index Stroke n Annually (%/year) | Recurrent Stroke n Annually (%/year) | Other vascular causes of death n Annually(%/year) | MI n Annually (%/year) | Other causes of death n Annually (%/year) | Cancer n Annually (%/year) |
| Head and neck cancer n=5 | 34.7 | 2 40 | 3 8.6 | 1 20 | 1 2.9 | 1 2.9 | 1 2.9 | 2 5.8 | 0 | 1 2.9 | 1 2.9 |
| Digestive system cancer n=15 | 59.4 | 3 20 | 4 6.7 | 1 6.7 | 1 1.7 | 2 3.4 | 2 3.4 | 2 3.4 | 1 1.7 | 9 15.2 | 7 11.8 |
| Lung and pleural cancer (C34) n=5 | 45.9 | 1 20 | 1 2.2 | 0 | 0 | 0 | 0 | 0 | 0 | 5 10.9 | 5 10.9 |
| Cancer of the bone and soft tissue n=1 | 9.4 | 0 | 0 | 0 | 0 | 0 | 0 | 0 | 1 10.6 | 1 10.6 | |
| Skin cancer n=3 | 48.3 | 1 33.3 | 2 4.1 | 0 | 1 2.1 | 1 2.1 | |||||
| Urological cancer n=25 | 247.6 | 9 36 | 13 5.3 | 8 32 | 14 5.7 | 3 1.2 | 1 0.4 | 9 3.6 | 3 1.2 | 10 4 | 6 2.4 |
| Bloods cancer n=2 | 7.1 | 1 50 | 1 14.1 | 1 50 | 1 14.1 | 0 | 1 14.1 | 1 14.1 | |||
| Multiple cancers n=11 | 124.9 | 5 45.5 | 6 4.8 | 4 36.4 | 5 4 | 1*0.8 | 4*3.2 | 6 4.8 | 5 4 | ||
| Death due to cancer n=26 | 195.8 | 4 15.4 | 4 2 | 2 7.7 | 3 1.5 | 26 13.3 | 26 13.3 | ||||
| Women | |||||||||||
| Head and neck cancer n=3 | 22.6 | 2 66.7 | 3 13.3 | 1 33.3 | 1 4.4 | 1 1.4 | 2 8.8 | 1 4.4 | |||
| Digestive system cancer n=15 | 115.3 | 10 66.7 | 16 13.9 | 2 13.3 | 2 1.7 | 6 5.2 | 2 1.7 | 7 6.1 | 5 4.3 | ||
| Lung and pleural cancer (C34) | 0 | ||||||||||
| Cancer of the bone and soft tissue n=1 | 4.1 | 0 | 1 100 | 1 24.3 | 1 24.4 | ||||||
| Skin cancer n=4 | 27.8 | 2 50 | 3 10.8 | 1 25 | 1 3.6 | 1 3.6 | 2 7.2 | 1 3.6 | 1 3.6 | ||
| Breast cancer (C50) n=18 | 97.3 | 8 44.4 | 15 15.4 | 3 16.7 | 4 4.1 | 3 3.1 | 4 4.1 | 4 4.1 | 1 1 | 6 6.2 | 3 3.1 |
| Gynaecological cancer n=15 | 184.7 | 5 33.3 | 8 4.3 | 2 13.3 | 2 1.1 | 2 1.1 | 3 1.6 | 2 1.1 | 0 | 2 1.1 | 1 0.5 |
| Urological cancer n=8 | 72.8 | 2 25 | 3 4.1 | 2 25 | 2 2.7 | 1 1.4 | 4 5.5 | 2 2.7 | 2 2.7 | 2 2.7 | |
| Blood cancer n=2 | 26.2 | 2 100 | 2 7.6 | 0 | 0 | 0 | 1 3.8 | 0 | 0 | 1 3.8 | 1 3.8 |
| Multiple cancers n=3 | 36.3 | 1 33.3 | 2 5.5 | 1 33.3 | 1 2.8 | 1 2.8 | 1 2.8 | 0 | |||
| Death due to cancer n=13b | 71.4 | 5 38.5 | 10 14 | 1 7.7 | 1 1.4 | 0 | 0 | 0 | 0 | 0 | 13 18.2 |
DISCUSSION
This study did not show any statistically significant differences in the occurrence of hypertension or hypercholesterolemia at baseline for men and women with cancer before the index event and/or during the 25-year follow-up in comparison with non-cancer patients. These results are in accordance with other trials regarding hypertension [10, 13-16], or hypercholesterolemia [10, 15-16], but contrary to the findings reported by Schwarzbach et al.[17], who reported an increased frequency of hypertension and of hyperlipidaemia in control subjects. The risk of cancer diagnosed within 3 years after admission in this trial was low (men 5.2%, women 4.2%), with a frequency quite similar to that reported in the NORSTROKE study [13], where 55 of 1282 (4.3%) ischaemic stroke patients had 64 cancers after stroke in a median follow- up time of 26.9 months. The risk of death due to cancer during the entire observation time was 18.8% in women vs. 38.8% in men (p=.013); 16.7% of women with breast cancer died due to cancer vs. 38.9% of men with prostate cancer, and the mortality rate due to lung cancer was considerably higher in men (100% vs. 0%). A higher mortality rate due to cancer in men resulted in a higher rate of cardiovascular mortality in women (65% vs. 48.4%), but there was also a non-significant difference in survival that favoured women (13% vs. 4.5%). Nilson et al. [4] reported cardiovascular death in 67.8% of 1303 women with a history of stroke vs. 28.7% of 12840 women without a history of stroke. In this trial cardiovascular death occurred in 64.7% of women with breast cancer, and death due to cancer occurred in 17.6% compared to 18.1% in the other trial [4]. Furthermore, cardiovascular death was significantly more common among patients without cancer (men, 89.3%; women, 90.9%).
Analysis of the annual risk of stroke and type of cancer in this observational study revealed great differences between sexes, with higher frequencies for women with head and neck cancers (8.6% vs.13.3%), digestive system cancers (6.7% vs. 13.9%), skin cancers (4.1% vs. 10.8%), and ultimate death due to cancer (2% vs. 14%) but almost similar risks of stroke in the context of multiple cancers (4.8% vs. 5.5%). The annual risk of stroke was higher in women with breast cancer than in men with urological cancer (15.4% vs. 5.3%). New stroke occurred significantly more frequently among male non-cancer patients than male cancer patients, (p=.025), as did fatal stroke (p=.004). Women with cancer had only a slightly lower annual risk of new stroke compared to non-cancer patients (8.8% vs. 9.7%), and there were no differences between patients with past cancer or cancer diagnosed during the observation time. For women, the annual recurrent stroke mortality was low for patients with cancer during the observation time (0.6%), but the annual recurrent stroke mortality was considerably higher for women compared to men with a history of cancer at admission (5% vs. 2.5%), which explains the differences between sexes regarding the occurrence of fatal strokes (men, 0.9%; women, 2.4%). That women with breast cancer had a high annual risk of stroke (15.4%) is consistent with other studies [3- 6]. Occurrence of AF at admission and/or during the observation time can only slightly explain these differences between sexes.
In this trial men and women with cancer had a lower annual risk of MI and fatal MI compared with corresponding noncancer patients (men, 38% and 43%; women, 55% and 71%), respectively. The annual risk of MI was lower for men with cancers than men without cancers for all cancer types except blood cancer, and in women for all types except cancers of the bone and soft tissue, but (only one) few patients were included in these groups. On the other hand, fatal MI was more common in men with cancer before admission and among those with cancer both before and after admission than in male non-cancer patients. That women with breast cancer had a slightly lower risk of MI is in agreement with another study, where treatment with tamoxifen was suggested to be an explanation for these differences [8]. Radiation treatment in patients with breast cancer could, on the other hand, be a negative factor for MI [7], as could antioestrogen treatment for men with prostate cancer [18].
CONCLUSIONS
This study has reflected the complexity of cancer, in that the type of cancer is of great importance regarding the cause of death but also in that cancer per se or its treatment seems to influence the annual risk of (fatal) stroke/MI compared to non-cancer patients. These findings support the need for further studies in order to determine the cause(s) of these differences.
CONFLICT OF INTEREST STATEMENT
The author declares that there is no conflict of interest.
REFERENCES
- Dearborn JL, Urrutia VC and Zeiler SR. (2014). Stroke and Cancer- A complicated relationship. J Neurol Transl Neurosci. 2(1): 1039.
- Navi BB, Reiner AS, Kamel H, Costantino L, et al. (2015). Association between incident cancer and subsequent stroke. Ann Neurol. 77(2): 291-300.
- Zoller B, Jianguang JI, Sundquist J, and Sundquist K. (2012). Risk of haemorrhagic and ischaemic stroke in patients with cancer: A nationwide follow-up study from Sweden. Europ. J Cancer. 48(12): 1875-1883.
- Nilsson G, Holmberg L, Garmo H, Terent A, et al. (2005). Increased incidence of stroke in women with breast cancer. Eur J Cancer. 41: 423-429.
- Plummer C, Henderson RD, O'Sullivan JD, and Read SJ. (2011). Ischemic stroke and transient ischemic attack after head and neck radiotherapy: a review. Stroke. 42(9): 2410-2418.
- Bushnell CD and Goldstein LB. (2004). Risk of ischemic stroke with tamoxifen treatment for breast cancer: a meta-analysis. Neurology. 63(7) 1230-1233.
- Darby SC, Ewertz M, McGale P, Bennet AM, et al. (2013). Risk of ischemic heart disease in women after radiotherapy for breast cancer. N Eng. J Med. 368(11): 987-998.
- McDonald CC, Alexander FE, Whyte BW, Forrest AP, et al. (1995). Cardiac and vascular morbidity in women receiving adjuvant tamoxifen for breast cancer in a randomised trial. The Scottish Cancer Trials Breast Group. BMJ. 311(7011): 977-980.
- Chaturvedi S, Ansell J and Recht L. (1994). Should cerebral ischemic events in cancer patients be considered a manifestation of hypercoagulability? Stroke. 25(6): 1215-1218.
- Lau K-K, Wong Y-K, Teo K-C, Chang RS-K, et al. (2014). Strokepatients with a past history of cancer are at increased risk of recurrent stroke and cardiovascular mortality. PLoS ONE. 9(2): e88283.
- Eriksson S-E. (2017). Secondary prophylactic treatment and long-term prognosis after TIA and different subtypes of stroke. A 25-year follow-up hospital-based observational study. Brain Behav.7(1):e00603. doi: 10.1002/ brb3.603.
- Eriksson SE and Olsson JE. (2001). Survival and recurrent strokes in patients with different subtypes of stroke. A fourteen-year follow-up study. Cerebrovasc Dis. 12(3): 171-180.
- Selvik HA, Thomassen L, Bjerkreim AT and Naess H. (2015). Cancer-Associated Stroke: The Bergen NORSTROKE Study. Cerebrovasc Dis Extra. 5(3): 107-113.
- Cestari DM, Weine DM, Panageas KS, Segal AZ, et al. (2004). Stroke in patients with cancer: incidence and etiology. Neurology. 62(11): 2025-2030.
- Zhang Y-Y, Chan DKY, Cordato D, Shen Q, et al. (2006). Stroke risk factor, pattern and outcome in patients with cancer. Acta Neurol Scand. 114(6): 378-383.
- Oberndorfer S, Nussgruber V, Berger O, Lahrmann H, et al. (2009). Stroke in cancer patients: a risk factor analysis. J Neurooncol. 94(2): 221-226.
- Schwarzbach CJ, Schaefer A, Ebert A, Held V, et al. (2012). Stroke and cancer: the importance of cancer-associated hypercoagulation as a possible stroke etiology. Stroke. 43(11): 3029-3034.
- Van Hemelrijck M, Garmo H, Holmberg L, Ingelsson E, et al. (2010). Absolute and relative risk of cardiovascular disease in men with prostate cancer: results from the Population-Based PCBaSe Sweden. J Clin Oncol. 28 (21): 3448-3456.