Previous Issues Volume 2, Issue 1 - 2017
Juvenile Myopia. Predicting the Progression Rate
Peter R. Greene1*, Antonio Medina2
1B.G.K.T. Consulting Ltd. Bioengineering Huntington, New York.
2Massachusetts Institute of Technology, Research Laboratory of Electronics, Cambridge, Mass, 02139.
Corresponding Author: Peter R Greene, B.G.K.T. Consulting Ltd. Bioengineering Huntington, New York, 11743, Tel: +1 631 935 56 66;E-Mail: [email protected]
Received Date: 24 Dec 2016 Accepted Date: 09 Jan 2017 Published Date: 13 Jan 2017
Copyright © 2017 Greene PR
Citation: Greene PR and Medina A. (2017). Juvenile Myopia. Predicting the Progression Rate. Mathews J Ophthalmol. 2(1): 012.
ABSTRACT
Regression plots are generated showing the strong correlation of myopia onset age with its progression rate, r = -0.77, p< 0.0025, and strong correlation of accumulated myopia 5 years after onset, r = -0.78, p < 0.001. Theory is confirmed, with all subjects showing excellent correlation coefficients, = -0.971, p < 0.005. Myopia progression rates vary from 0.2 to 1.0 diopters (D) per year from one individual to the next. Age of onset for myopia is 10.6 yrs. +/-5.4 yrs. Initial refraction at onset is -1.14 D +/-0.55 D. Practical applications of this work include delaying correction for myopes, and juvenile susceptibility to myopia at various age levels. Feedback Theory predicts the results.
KEYWORDS
Emmetropia; Emmetropization; Myopia; Susceptibility; Feedback Model; Under Correction.
INTRODUCTION
TMyopia has an estimated prevalence of 41% among adults in the United States, and the myopia prevalence is increasing Vitale et al. [1]. Among Asian populations, the prevalence is even higher with rates as high as 60% among adolescents age 11 to 17 yrs in China [2-4]. The course of myopia typically follows a pattern that begins with an initial emmetropic phase, followed by a myopic onset that usually occurs in the early school years, which is followed by a myopic depression that tends to stabilize in the mid to late teenage years [5]. These are general trends, early or late onset myopia is also possible and a more modest progression may occur during early adulthood before fully stabilizing.
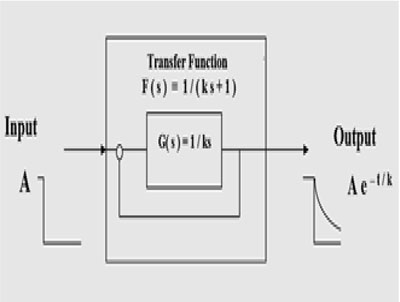
Figure 1a: The transfer function that describes emmetropization is F(s) = 1/ (ks+1), where k is the time constant of each individual and s is the complex variable. G(s) = 1/ks is the forward function of the transfer function.
Several facts are established that allow an understanding of refraction development of the eye as a system. Emmetropization and refractive development is a feedback process in humans [6-11]. There is now considerable evidence showing that there is feedback control of emmetropization. Emmetropic or uncorrected eyes follow an exponential development of refractive error in humans, as shown in Figure 1a. An exponential development is the response of a first-order feedback system to a constant-level step input signal [9, 10]. Such a 1st order model will quantitatively model not only the mechanism of emmetropization, but also the effect of lenses [6, 7]. The refractive state of the eye is alterable with external stimuli, including lid suture. (Meyer et al. [12]; Raviola & Wiesel [13]; Greene & Guyton [14]; Hoyt at al. [15]; Wallman & Winawer [16]). Medina & Fariza [8] showed that corrective lenses applied to the eye are step input stimuli to the emmetropization system and that the response of a first order system (Feedback Theory) to an input determined by the power of the corrective lenses fits refraction data from ametropic subjects that wore those lenses [8]. Medina [9, 10] showed that a myope that is fully corrected continuously places the emmetropization feedback system in an open loop condition, as shown in Figure 1b. Continuous correction alters the feedback loop rendering it inoperative. He also found that refractive data from the eyes of 13 myopic subjects followed straight lines as predicted by Feedback Theory, Figure 2. Fledelius presents distribution diagrams of onset age for myopia from age 6 to 27 (N=184 subjects), which can be compared to Figure 2 here [17].
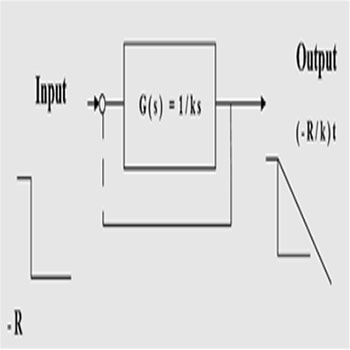
Figure 1b: Open loop transfer function of the feedback system of transfer function 1/ (ks+1). Broken lines denote the loop is open. This open loop function describes continuous correction or visual form deprivation (constant error). The variables are t, time and s, complex variable.
Figure 2 shows the refractive errors of right eyes of 13 myopic human subjects versus age (symbols) and linear prediction of open loop system (solid lines). Myopia rates range from -0.2 to -1.0 D/yr. Correlation coefficients range from -0.907 to -0.998, with a mean of = -0.971, p< 0.005. Three other similar studies from the literature report essentially the same myopia progression rates, Oakley & Young [18], Goss [19], and Gwiazda et al. [20, 21] for young individuals. Goss & Rainey et al. [22] report myopia rates (N=42 subjects) of -0.72 D/yr during the school year, compared with -0.39 D/yr during the summer months.
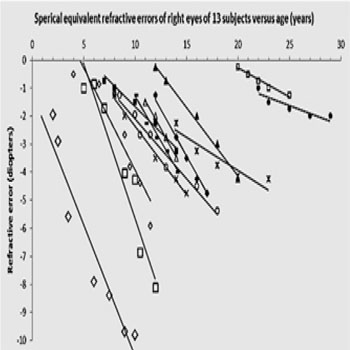
Figure 2: Refractive errors of right eyes of 13 myopic human subjects versus age (symbols) and linear prediction of open loop system (R/k, solid lines), from Medina [9, 10].
MATERIALS AND METHODS
The clinical techniques and data reduction procedures employed to generate Figure 2 are described in Medina et al. [9, 10]. These straight-line trajectories are typical of juvenile progressive myopes. The slope of these lines allows us to correlate average myopia progression rate versus onset age t1 (Figure 3a). Another benchmark indicator of myopia progression is the total myopia accumulated 5 years after onset, Figure 3b, graphed versus initial onset age. Correlation coefficient r and significance level p quantify the accuracy of the regression.
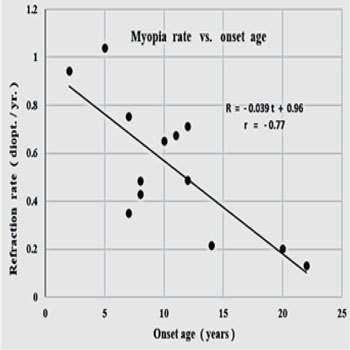
Figure 3a: Myopia progression rate vs. age of onset, r = - 0.77, p < 0.0025, < R’> = - 0.55 D/yr +/- 0.27 D/yr.
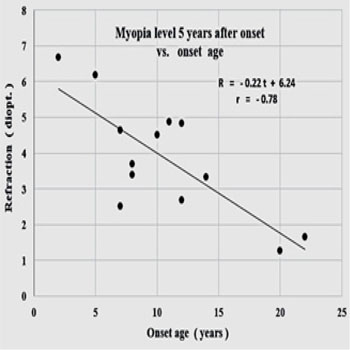
Figure 3b: Myopia level 5 years after onset vs. onset age, r = - 0.78, p<0.001, = - 4.51 D. +/-1.28 D.
RESULTS
Figures 3a and 3b show that myopia rate and total acquired myopia 5 years after onset are strongly correlated with onset age, r = -0.77, p< 0.0025, and r = -0.78, p< 0.001 respectively. Average myopia onset age is = 10.6y +/- 5.4y (N=13). Initial refraction at onset is on average = -1.14D. +/- 0.55D, correlation with age of onset r = -0.30, p< 0.25.
DISCUSSION
These results indicate that the juvenile myope is twice as susceptible to myopia progression at age 5 as at age 15 (-0.8 D/yr. versus -0.4 D/yr.) and twice as susceptible at age 10 as at age 18 (-0.6 D/yr. vs. -0.3 D/yr.). Likewise, at onset, the initial refraction at age 5 is expected to be 50% greater than at age 18, (-1.3 D. vs. -0.9 D. respectively). Confirming these results it was recently found that the risk of high myopia can be predicted based on age of onset of myopia [23]. Feedback Theory predicts the results as it provides that the slope of the progression line is proportional to the myopia at onset.
CONCLUSION
Feedback Theory and the observations described here have some practical implications concerning the correction or under correction of myopes [24-28].
REFERENCES
- Vitale S, Sperduto RD and Ferris FL 3rd. (2009). Increased prevalence of myopia in the United States between 1971- 1972 and 1999-2004. Arch Ophthalmol. 127(12): 1632- 1639.
- Congdon N, Wang Y, Song Y, Choi K, et al. (2008). Visual disability, visual function, and myopia among rural chinese secondary school children: the Xichang Pediatric Refractive Error Study (X-PRES)-report 1. Invest Ophthalmol Vis Sci. 49(7): 2888-2894.
- Greene PR, Vigneau ES and Greene J. (2015). Exponential prevalence and incidence equations for myopia. Clin Exp Opt. 98(3): 210-213.
- Wu LJ, You QS, Duan JL, Luo YX, et al. (2015). Prevalence and associated factors of myopia in high-school students in Beijing. PLoS One. 10(3): e0120764.
- Thorn F, Gwiazda J and Held R. (2005). Myopia progression is specified by a double exponential growth function. Opt Vis Sci. 82(4): 286-297.
- Medina A. (1987). A model for emmetropization. The effect of corrective lenses. Acta Ophthalmol (Copenh). 65(5): 565-571.
- Medina A. (1987). A model for emmetropization: predicting the progression of ametropia. Ophthalmologica. 194(2-3): 133-139.
- Medina A and Fariza E. (1993). Emmetropization as a firstorder feedback system. Vision Res. 33(1): 21-26.
- Medina A. (2015). The progression of corrected myopia. Graefes Arch Clin Exp Ophthalmol. 253(8): 1273-1277.
- Medina A and Greene PR. (2015). Progressive Myopia and Lid Suture Myopia are explained by the Same Feedback Process: a Mathematical Model of Myopia. J Nat Sci. 1(6): e121.
- Medina A. (2015). Detecting the effect of under- correcting myopia. Graefes Arch Clin Exp Ophthalmol. 254(2): 409-410.
- Meyer C, Mueller MF, Duncker GI and Meyer HJ. (1999). Experimental animal myopia models are applicable to human juvenile-onset myopia. Surv Ophthalmol. 44(Suppl 1): S93-S102.
- Raviola E and Wiesel TN. (1985). An animal model of myopia. N Engl J Med. 312(25): 1609-1615.
- Greene PR and Guyton DL. (1986). Time course of rhesus lid-suture myopia. Exp Eye Res. 42(6): 529-534.
- Hoyt CS, Stone RD, Fromer C and Billson FA. (1981). Monocular axial myopia associated with neonatal eyelid closure in human infants. Am J Ophthalmol. 91(2): 197-200.
- Wallman J and Winawer J. (2004). Homeostasis of eye growth and the question of myopia. Neuron. 43(4): 447-468.
- Fledelius HC. (1998). University Myopia - A Comparison between Scandinavian and Asian Findings. Proc. 7th Intl. Myopia Conf., Taiwan. Myopia Updates II. 11-15.
- Oakley KH and Young FA. (1975). Bifocal control of myopia. Am J Optom Physiol Opt. 52(11): 758-64.
- Goss DA. (1987). Linearity of refractive change with age in childhood myopia progression. Am J Optom Physiol Opt. 64(10): 775-880.
- Gwiazda J, Hyman L, Hussein M, Everett D, et al. (2003). A randomized clinical trial of progressive addition lenses versus single vision lenses on the progression of myopia in children. Invest Ophthalmol Vis Sci. 44(4): 1492-1500.
- COMET Group. (2013). Myopia stabilization and associated factors among participants in the Correction of Myopia Evaluation Trial (COMET). Invest Oph Vis Sci. 54(13): 7871-7984.
- Goss DA and Rainey BB. (1998). Relation of childhood myopia progression rates to time of year. J Am Optom Assoc. 69(4): 262-266.
- Chua SY, Sabanayagam C, Cheung YB, Chia A, et al. (2016). Age of onset of myopia predicts risk of high myopia in later childhood in myopic Singapore children. Ophthalmic Physiol Opt. 36(4): 388-394.
- Li SY, Li SM, Zhou YH, Liu LR, et al. (2015). Effect of undercorrection on myopia progression in 12-year-old children. Graefes Arch Clin Exp Ophthalmol. 253(8): 1363-1368.
- Chung K, Mohidin N and O'Leary DJ. (2002). Undercorrection of myopia enhances rather than inhibits myopia progression. Vision Res. 42(22): 2555-2559.
- Adler D and Millodot M. (2006). The possible effect of undercorrection on myopic progression in children. Clin Exp Optom. 89(5): 315-321.
- Vasudevan B, Esposito C, Peterson C, Coronado C, et al. (2014). Under-correction of human myopia--is it myopigenic?: a retrospective analysis of clinical refraction data. J Optom. 7(3): 147-152.
- Ong E, Grice K, Held R, Thorn F, et al. (1999). Effects of spectacle intervention on the progression of myopia in children. Optom Vis Sci. 76(6): 363-369.