Previous Issues Volume 1, Issue 3 - 2016
Fulminant Clostridium difficile Infection in Patients Initially Presenting in the Emergency Department: A Retrospective Case Series Analysis: A Proposal for Mortality- Predictive Values Based on the Peak WBC Count and Peak Serum Lactate Level
Anne M. Darlington1, Alan Lucerna2, James Espinosa2, Victor Scali3
1Department of Emergency Medicine, Bayhealth Medical Center, Dover, DE, USA.
2Department of Emergency Medicine, Rowan University SOM Kennedy University Hospital, Stratford, NJ, USA.
3Co-Director, Emergency Medicine Residency, Rowan University SOM.
Corresponding Author: James Espinosa, Department of Emergency Medicine, Rowan University SOM Kennedy University Hospital, 18 East Laurel Road, Stratford, NJ 08084, USA. Tel: +1 646 241 5695; E-Mail: [email protected]
Received Date: 21 Apr 2016
Accepted Date: 11 Jul 2016
Published Date: 14 Jul 2016
Copyright © 2016 Espinosa J
Citation: Darlington AM, Lucerna A, Espinosa J and Scali V. (2016). Fulminant Clostridium difficile Infection in Patients Initially Presenting in the Emergency Department: A Retrospective Case Series Analysis: A Proposal for Mortality-Predictive Values Based on the Peak WBC Count and Peak Serum Lactate Level. Mathews J Emergency Med. 1(3): 013.
ABSTRACT
Through a retrospective chart review, significant risk factors for morbidity and mortality of patients with fulminant Clostridium difficile colitis were studied. A presenting or peak white count of less than 16,500 represents lower risk. (p = 0.001). A peak or presenting white count of greater than 30,000 represents the highest risk. (p = 0.001). A peak lactate of greater than 4 is statistically linked to mortality (p = 0.03) A peak lactate of greater than 5 is even more statistically linked to mortality (p = 0.02). This study suggests both lactate above 5 and peak white blood cell count above 30,000 have a significant role in predicting mortality from this disease. There is also the suggestion that elevated white blood cell count on presentation may play a role in increased mortality. There are few published studies evaluating elevated lactate and with fulminant C. difficile infection; this could be an area for further investigation.
KEYWORDS
Mortality-Predictive; Clostridium difficile; Emergency Department; Peak Serum Lactate Level.
INTRODUCTION
Clostridium difficile colitis has emerged over the past decade as a serious cause of morbidity and in hospitalized patients. It has been reported to affect up to 8% of hospitalized patients with 1-3% progressing to fulminant Clostridium difficile colitis [1]. The hallmarks of Clostridium difficile infection usually include leukocytosis and diffuse watery diarrhea [2]. There have been several studies that have attempted to identify risk factors associated with a fulminant course. Leukocytosis with a white blood cell count > 15,000 and renal failure with creatinine > 50% above baseline have been associated with severe Clostridium difficile infections that failed to respond to treatment [3]. One retrospective study looked at 199 patients with fulminant Clostridium difficile who required colectomy or admission to the ICU, as markers for disease severity. In this study, independent risk factors for Clostridium difficile mortality were identified as age over 70 years, severe leukocytosis, bandemia, and cardiorespiratory failure [4]. Girotra et al also identified several factors in patients with C. difficile infection that may be risk factors for fulminant infection, including age > 70, prior Clostridium difficile infection, clinical triad of increasing abdominal pain, distention and diarrhea, profound leukocytosis > 18,000, hemodynamic instability and use of antiperistaltic medications [1]. Some evidence also exists that suggests that a prior appendectomy leads to a higher rate of fulminant Clostridium difficile requiring colectomy [5].
MATERIALS AND METHODS
The purpose of this study was to identify risk factors that may predict the development of fulminant or fatal Clostridium difficile colitis in a population of patients who presented to an emergency department and were directly or ultimately admitted to the ICU with severe Clostridium difficile infection. The methodology was a retrospective chart review study which investigated risk factors for mortality in cases of fulminant Clostridium difficile infection within a 3 hospital healthcare system. Subjects were identified based on admission to the ICU from the ED (either directly to the ICU or subsequently admitted to the ICU setting) with a diagnosis of Clostridium difficile colitis. A review of their charts was conducted with the purpose of gathering data such as age, creatinine level at presentation, and white blood cell count. This data, and any subsequent extracted data, were assigned an unidentifiable code to prevent any potential exposure of patients' protected health information (PHI). The time frame for the study was January 1, 2012 to December 31, 2013. Subjects for retrospective chart review had been admitted to the ICU, directly or subsequently after admission from the ED, with a diagnosis of Clostridium difficile infection, from January 1, 2012 to December 31, 2013. Subjects were eligible for retrospective chart study if they were between the ages of 18 and 100 and had been admitted to the ICU, either directly or indirectly from the ED, with a diagnosis Clostridium difficile. The study did not include children or pregnant patients.
RESULTS
Of 199 charts retrospectively reviewed with diagnosis of Clostridium difficile infection, a cohort of 21 patients met the admission criteria to our study. The average age of patients in this study was 76 years of age. The mean white count at presentation was 19, 660 (StDev 7,510). The mean peak white count was 32,910 (StDev 21,760) with a minimum of 11,500 and a maximum of 101,900. The range was 90,400 (Figure 1).
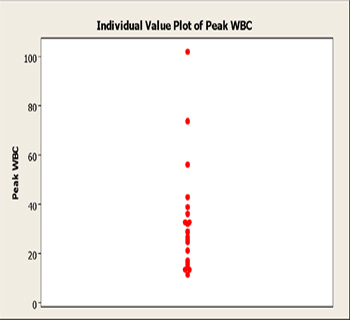
Figure 1: Individual value plot, peak WBC count.
The presenting and mean WBC count distributions were significantly different (P-value 0.01) (Figure 2,3).
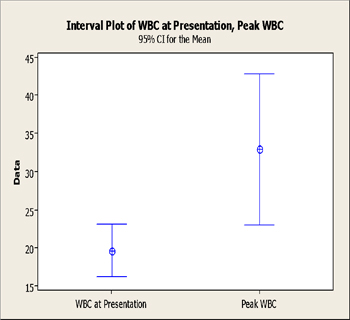
Figure 2: Presenting WBC, Peak WBC: Interval plot with 95% confidence intervals for the means of the two distributions.
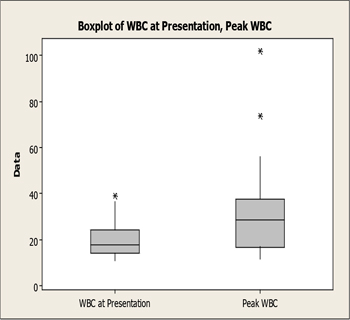
Figure 3: Boxplots compared, WBC at presentation and peak WBC.
The mean lactate at presentation was 3.2 (StDev 1.673). 7 patients (33.3%) had a lactate of 4 or greater on presentation. Conversely, 15 patients (66.7%) did not. These two proportions were statistically different (p = < 0.008). The mean peak lactate was 5.94 (StDev 6.77). 12 patients (57.1%) had a peak lactate of > 4. Conversely, 9 patients (42.9%) did not. These two proportions were not statistically different (p = < 0.35). The difference between the percent of patients presenting with a lactate of 4 or greater and the percent peak lactate of 4 or greater in our study was not statistically different (p = 0.11). The presenting and peak lactate levels were not statistically different, although they approached statistical significance (p = .06) (Figures 4,5).
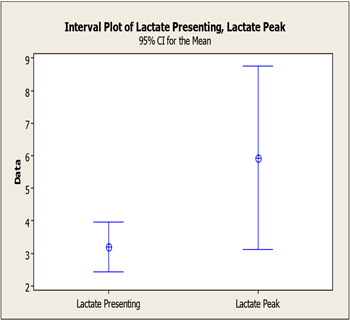
Figure 4: Interval plot, presenting vs peak lactate.
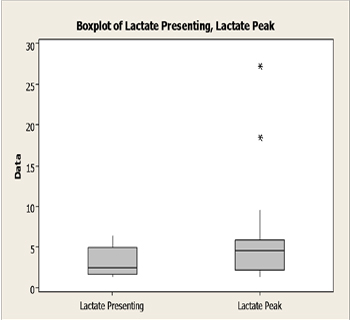
Figure 5: Boxplot presenting vs. peak lactate levels.
There was poor statistical correlation between the WBC as presentation and the lactate at presentation. (p = 0.626). There was poor correlation between the peak WBC and the peak lactate (p = 0.46). Two patients were already on dialysis at the time of presentation to the ED (9.5%). 19 patients were not on dialysis at the time of presentation to the ED (90.5%) These two proportions were statistically different (p = < 0.001). 11 patients (52%) had a history of a prior C. difficile infection. Conversely, 10 patients (48%) did not have a history of a prior C. difficile infection. These proportions were not statistically different. (p = .757) 2 patients (9.5%) had a history of a prior appendectomy. Conversely, 19 patients (90.5%) did not have a history of a prior appendectomy. These proportions were statistically significant (p = .001). The mean length of stay (LOS) was 10.29 days. The minimum LOS was 2 days. The maximum LOS was 21 days. The median LOS was 14 days. 7 patients (33.3%) died. 14 patients (66.7%) lived. These two proportions were statistically different. (p = 0.022) In reference to qualitative variables, (gender, dialysis on admission, prior C diff, prior appendectomy) none of the qualitative variables studied showed a statistical relationship to outcome. In reference to quantitative variables, two of the variables studied showed a statistically significant relationship to the outcome of mortality. The peak WBC count was higher in the cohort of patients who died (mean 24,900, StDev 8.96) versus those who lived (16,990, StDev 5,170). This difference was statistically significant (p = .035). LOS showed an inverse relationship to mortality. LOS (mean) was higher in patients who survived (mean 12.21, StDev 5.03) than in those who died (mean 6.43, StDev 4.43). This difference was statistically significant (p = .018). The presenting mean WBC count was higher in patients who died. The difference approached statistical significance (p = .06). The peak lactate was also higher in those who died (p = .079). There was no relationship of age (mean) to mortality. There was no relationship of presenting lactate (mean) or of presenting creatinine (mean) to mortality. Based on the data, the following cut points for risk are proposed: A presenting or peak white count of less than 16,500 represents lower risk according to this data (p = 0.001). A peak or presenting white count of greater than 30,000 represents the highest risk in this dataset (p = 0.001) substantiate the cutoff for lower risk of mortality from fulminant C. diff colitis.
DISCUSSION
Of 199 charts retrospectively reviewed with diagnosis of Clostridium difficile infection, a cohort of 21 patients met the admission criteria to our study. The average age of patients in this study was 76 years of age. This suggests that patients with this diagnosis tend to be older. There was no finding in this study of a relationship between age and mortality. Other studies have noted that increasing age appears to correlate with mortality. A study by Giorta et al compared 18 patients with fulminant C. difficile colitis with 49 patients with C. difficile associated diarrhea. They found that patients with fulminant C. difficile colitis were older (mean age 77 +/- 13 years) than the age of the patients with C. difficile associated diarrhea (65+/- 20 years).1 Similar results were found by Loo et al in a prospective study to determine the incidence of nosocomial C. difficile associated diarrhea designed to identify risk factors. They found that out of 1703 patients identified, the 30 day mortality increased with age.6 Salihamer et al also found age over 70 years to be an independent predictor of mortality.4 In out study design, only cases of fulminant C. difficile colitis were included. Most of these aforementioned studies looked at cases of simple C. difficile in comparison to fulminant C. difficile. Inside a cohort of fulminant C. difficile, there may in fact not be an association of age to mortality. Another possibility is that a larger study might detect such an association. In addition, in our study design, all patients initially presented to the emergency department. The mean white count at presentation was 19, 660 (StDev 7,510). Girotra et al found similarly elevated white blood cell counts when comparing cases of fulminant C. difficile colitis to patients with C. difficile associated diarrhea. In their study, the white blood cell count was 18,600 +/- 15,800 in patients with fulminant C. difficile colitis and 10,700 +/- 5,200 for those with C. difficile associated diarrhea. This was statistically significant with a P value of 0.04.1. This is similar and comparable to our findings. Sailhamer et al also noted a statistically significant relationship of elevated white blood cell counts or leucopenia to mortality. White blood cell counts above 35,000 or below 4,000 were associated with increased mortality (P value 0.01) [4]. The correlation with elevated WBC count at presentation and mortality approached statistical significance in our study. A larger sample size may yield statistical significance. The mean peak white count was 32,910 (StDev 21,760) with a minimum of 11,500 and a maximum of 101,900. The range was 90,400. A PubMed search did not identify other studies that looked at the relationship of the peak white count to mortality. The presenting and mean WBC count distributions were significantly different (P-value 0.01). The mean lactate at presentation was 3.2 (StDev 1.673). 7 patients (33.3%) had a lactate of 4 or greater on presentation. Conversely, 15 patients (66.7%) did not. These two proportions were statistically different (p = < 0.008). The mean peak lactate was 5.94 (StDev 6.77) 12 patients (57.1%) had a peak lactate of > 4. Conversely, 9 patients (42.9%) did not. These two proportions were not statistically different. (p = < 0.35) The difference between the percent of patients presenting with a lactate of 4 or greater and the percent peak lactate of 4 or greater in our study was not statistically different (p = 0.11). The presenting and peak lactate levels were not statistically different, although they approached statistical significance (p = .06). There was poor statistical correlation between the WBC as presentation and the lactate at presentation (p = 0.626). Similarly, there was poor correlation between the peak WBC and the peak lactate (p = 0.46). Comparing these findings to the literature, few studies have evaluated the relation of elevated lactate to mortality in fulminant C. diff colitis. A study by Dallas, et al evaluated 61 patients with fulminant C. difficile infection requiring colectomy. When compared to the patients discharged, those with elevated lactate had increased in-hospital mortality (p = 0.004) [7]. Pepin et al also noted similar increase in mortality for lactate =5 [8]. The mean creatinine at presentation was 2.488 (StDev 1.887). In a study of 398 patients with C. difficile colitis, Dudukgian et al determined preexisting renal insufficiency was a significant risk factor for mortality from C. diff colitis (p = 0.009) as well as clinical signs of acute renal failure (p < 0.001). Similar conclusions about renal failure being an independent risk factor for mortality were drawn in a study of 69 patients who underwent colectomy for fulminant C. difficile colitis [10]. Two patients were already on dialysis at the time of presentation to the ED (9.5%). 19 patients were not on dialysis at the time of presentation to the ED (90.5%) These two proportions were statistically different (p = < 0.001). 11 patients (52%) had a history of a prior C. difficile infection. Conversely, 10 patients (48%) did not have a history of a prior C. difficile infection. These proportions are not statistically different. (p=.757) 2 patients (9.5%) had a history of a prior appendectomy. Conversely, 19 patients (90.5%) did not have a history of a prior appendectomy (Figure 19). These proportions are statistically significant (p = .001). A retrospective chart review of 55 patients who underwent colectomy for fulminant C. difficile colitis did indicate that these patients had increased incidence of appendectomy when compared to the lifetime incidence which conflicts with the results found in this study [5]. Additional studies with larger sample sizes are needed to substantiate this. The mean length of stay (LOS) was 10.29 days. The minimum LOS was 2 days. The maximum LOS was 21 days. The median LOS was 14 days. It is difficult to assess the LOS and the association with mortality since a shorter LOS does not necessarily indicate that the patient was discharged. Some of the patients in the study with very short LOS died after almost immediately after their admission, while others with similar LOS responded to treatment for their fulminant colitis. 7 patients (33.3%) died. 14 patients (66.7%) lived. These two proportions were statistically different. (p = 0.022) In reference to qualitative variables, (gender, dialysis on admission, prior C diff, prior appendectomy) none of the qualitative variables studied showed a statistical relationship to outcome. The peak WBC count was higher in the cohort of patients who died (mean 24,900, StDev 8.96) versus those who lived (16,990, StDev 5,170). This difference was statistically significant (p = .035). LOS showed an inverse relationship to mortality. LOS (mean) was higher in patients who survived (mean 12.21, StDev 5.03) than in those who died (mean 6.43, StDev 4.43).This difference was statistically significant (p = .018). The presenting mean WBC count was higher in patients who died. The difference approached statistical significance (p = .06). The peak lactate was also higher in those who died (p = .079). There was no relationship of age (mean) to mortality. There was no relationship of presenting lactate (mean) or of presenting creatinine (mean) to mortality.
Based on the data, the following cut points for risk based on the white count are proposed:A presenting or peak white count of less than 16,500 represents lower risk according to this data (p = 0.001). A peak or presenting white count of greater than 30,000 represents the highest risk in this dataset (p = 0.001). Other studies have demonstrated increased mortality with white counts greater than 30,0004,8,11, , but little data seems to exist demonstrating lower risk with white blood cell counts less than 16,500. More data and a larger sample size, would be needed to substantiate the cutoff for lower risk of mortality from fulminant C. diff colitis. Further investigation would also be needed to determine additional risk factors for mortality for those patients whose WBC count falls in the "gray zone" between 16,500-30,000.
Based on the data, the following cut points for risk based on lactate level are proposed: A presenting lactate of less than or greater than 4, or of less than or great than 5 is not related to mortality and would not be a helpful indicator of mortality(p = .753) A peak lactate of greater than 4 is statistically linked to mortality (p=0.03) A peak lactate of greater than 5 is even more statistically linked to mortality (p=0.02) The relationship between elevated lactate and increased mortality from fulminant C. difficile has not been investigated much in the literature. A few other studies have indicated that increased lactate is associated with greater mortality from fulminant C. difficile colitis specifically, lactate above 5 [7,8]. There is need for further investigation in this area.
There are several limitations to this study: This is a retrospective chart review. The sample size was relatively small. A larger study may reveal statistical significance in the presenting white blood cell count in relationship to mortality. In addition, the velocity of elevation of the white count and/or lactate may or may not have prognostic relevance. A larger study could look at this relationship.
CONCLUSION
Patients with this diagnosis tend to be older. There was no gender-based finding in reference to patients studied, or in reference to mortality. The mean white count at presentation was 19, 660 (StDev 7,510). The mean peak white count was 32,910 (StDev 21,760) with a minimum of 11,500 and a maximum of 101,900. The range was 90,400. Thus, this appears to be a disease in which peak white counts can indeed be remarkably elevated. The mean lactate at presentation was 3.2 (StDev 1.673). The difference between the percent of patients presenting with a lactate of 4 or greater and the percent peak lactate of 4 or greater was not statistically different (p = 0.11). The presenting and peak lactate levels were not statistically different, although they approached statistical significance (p = .06). There was poor statistical correlation between the WBC and serum lactate at presentation (p = 0.626). Similarly, there was poor correlation between the peak WBC and the peak lactate (p = 0.46). The mean creatinine at presentation was 2.488 (StDev 1.887). Two patients were already on dialysis at the time of presentation to the ED (9.5%). 19 patients were not on dialysis at the time of presentation to the ED (90.5%) These two proportions were statistically different (p = < 0.001).
Based on the data, the following cut points for risk based on the white count are proposed: A presenting or peak white count of less than 16,500 represents lower risk according to this data (p = 0.001). A peak or presenting white count of greater than 30,000 represents the highest risk in this dataset (p = 0.001).
Based on the data, the following cut points for risk based on lactate level are proposed: A presenting lactate of less than or greater than 4, or of less than or great than 5 is not related to mortality and would not be a helpful indicator of mortality (p = .753). A peak lactate of greater than 4 is statistically linked to mortality (p = 0.03). A peak lactate of greater than 5 is even more statistically linked to mortality (p = 0.02). Although there is a need for further investigation and definition of the risk factors for fulminant C. diff colitis, this study suggests both lactate above 5 and peak white blood cell count above 30,000 have a significant role in predicting mortality from this disease. There is also the suggestion that elevated white blood cell count on presentation may play a role in increased mortality. Since there are few published studies evaluating elevated lactate and its' association with fulminant C. difficile infection, this could be an area for further investigation. This may especially be beneficial to the Emergency Medicine physicians in that early identification of elevated lactate in the Emergency Department could lead to interventions that could decrease mortality. Further clarification of risk factors could lead to early interventions in the Emergency Department that decrease overall mortality from this disease.
REFERENCES
- Girotra M, Kumar V, Khan JM, Damisse P, et al. (2012). Clinical Predictors of Fulminant Colitis in Patients with Clostridum difficlile Infection. Saudi J Gastroenterol. 18(2), 133-139.
- Bartlett JG and Gerding DN. (2008). Clinical recognition and diagnosis of Clostridium difficile infection. Clin Infect Dis. 46(Suppl 1).
- Bauer MP, Hensgens MP, Miller MA, Gerding DN, et al. (2012). Renal failure and leukocytosis are predictors of a complicated course of Clostridium difficile infection if measured on day of diagnosis. Clin Infect Dis. 55 Suppl 2, S149-53.
- Sailhamer EA, Carson K, Chang Y, Zacharias N, et al. (2009). Fulminant Clostridium difficile colitis: patterns of care and predictors of mortality. Arch Surg. 144(5), 433-439.
- Clanton J, Subichin M, Drolshagen K, Daley T, et al. (2013). Fulminant Clostridium difficile infection: An association with prior appendectomy? World J Gastrointest Surg. 5(8), 233- 238.
- Loo VG, Poirier L, Miller MA, Oughton M, et al. (2005). A predominately clonal multi institutional outbreak of Clostridium difficle associated diarrhea with high morbidity and mortality. N Engl J Med. 353(23), 2442-2449.
- Dallas KB, Conren A and Divino CM. (2007). Life after colectomy for fulminant Clostridium difficile colitis: a 7-yeas follow up study. Am J Surg. 207(4), 533-539.
- Pepin J, Vo TT, Boutros M, Marcotte E, et al. (2009). Risk factors for mortality following emergency colectomy for fulminant Clostridium difficile infection. Dis Colon Rectum. 52(3), 400-405.
- Dudukgian H, Sie E, Gonzalez-Ruiz C, Etzioni DA, et al. (2010). C. difficile colitis--predictors of fatal outcome. J Gastrointest Surg. 14(2), 315-322.
- Seder CW, Villalba MR, Robbins J, Ivascu FA, et al. (2009). Early colectomy may be associated with improved survival in fulminant Clostridium difficile colitis: an 8-year experience. Am J Surg. 197(3), 302-307.
- Ali SO, Welch JP and Dring RJ. (2008). Early surgical intervention for fulminant pseudomembranous colitis. Am Surg. 74(1), 20-26.