Previous Issues Volume 1, Issue 2 - 2016
Study of Ultrasound Guided Lumbar Puncture: Simulation Study with Ultrasound Mannequins with Assessment for Provider Preference for Patient and Ultrasound Positioning
Robert Horn1, James Espinosa2, Victor Scali3
1 Department of Emergency Medicine, Saint Mary Medical Center, Langhorne, PA, USA.
2 Department of Emergency Medicine, Rowan University SOM Kennedy University Hospital, Stratford, NJ, USA.
3 Program Co-Director, Emergency Medicine Residency, Rowan University SOM, Stratford, NJ, USA.
Corresponding Author: James Espinosa, Department of Emergency Medicine, Rowan University SOM Kennedy University Hospital, 18 East Laurel Road, Stratford, NJ 08084, USA, Tel: +1 646 241 5695; E-Mail: [email protected]
Received Date: 05 Mar 2016
Accepted Date: 04 Apr 2016
Published Date: 11 Apr 2016
Copyright © 2016 Espinosa J
Citation: Horn R, Espinosa J and Scali V. (2016). Study of Ultrasound Guided Lumbar Puncture: Simulation Study with Ultrasound Mannequins with Assessment for Provider Preference for Patient and Ultrasound Positioning. Mathews J Emergency Med. 1(1): 008.
ABSTRACT
Lumbar puncture without imaging is a technique that relies on a provider’s “feel”. Ultrasound guidance has the potential to improve success rates and limit patient discomfort [1,2]. Even when ultrasound is only used to locate the correct anatomic structures to perform a lumbar puncture but not used for the procedure. Retrospectively, it has been shown that ultrasound can reduce failure rates. The purpose of this study was to use lumbar puncture simulation models to directly compare success rates using standard technique vs ultrasound guidance. The majority of participants (66.6%) preferred that the ultrasound machine be located on their right side. This was statistically significant. (p = .05). The mean times and the number of needle adjustments for the standard (non-obese) model, with and without ultrasound, were not statistically significant. The mean times and the number of needle adjustments for the obese model, with and without ultrasound, were also not statistically significant. There was an interesting association with training level. When the data was analyzed by PGY status, upper level PGY status participants (defined as PGY 3/4/5) took less time and showed less variation than lower level PGY status participants (defined as PGY 1/2) when no ultrasound was used. The difference was not statistically significant. Upper level PGY status participants made fewer adjustments and showed less variation in adjustments than lower level PGY status participants when no ultrasound was used. The difference was not statistically significant. In reference to time performance, the mean time shown by the upper PGY (3,4,5) was lower for all four combinations of two models (standard and obese) by the two methods (no ultrasound v ultrasound). The mean time performance for the obese model with the use of ultrasound was less for upper PGY status participants than for lower. This difference was statistically significant. (P-Value = 0.047) When teaching the procedure of ultrasound guided lumbar puncture our study shows a statistically significant difference in an upright model with the ultrasound machine located to the right. This suggests that this a reasonable setup to help facilitate the practitioners comfort and learning. There is no statistical difference to suggest that the blind (non-ultrasoundsupported) technique is faster or requires less repositions than ultrasound guided Future studies may show a difference in lumbar puncture with ultrasound on simulated models with appropriate instruction and training sessions in the technique. It is possible that with several training sessions the use of ultrasound may be a useful adjunct.
KEYWORDS
Ultrasound use in Lumbar Puncture; Ultrasound in Emergency Medicine; Ultrasound in Residency; Ultrasound Using Simulated Models.
INTRODUCTION
Lumbar puncture without imaging is a technique that relies on a provider’s “feel”. Ultrasound guidance has the potential to improve success rates and limit patient discomfort [1,2]. Even when ultrasound is only used to locate the correct anatomic structures to perform a lumbar puncture but not used for the procedure [1,2]. Retrospectively, it has been shown that ultrasound can reduce failure rates [3,4]. The purpose of this study was to use lumbar puncture simulation models to directly compare success rates using standard technique vs ultrasound guidance.
MATERIAL AND METHODS
The study was prospective, designed to assess the ability of resident emergency physicians to perform a lumbar puncture with the standard technique vs. an ultrasound guided technique. Participants were recruited by verbal invitation at the weekly academic emergency medicine conference. Volunteers were requested before the start of the conference and were given the opportunity at the end of the conference to discuss the details of their participation as well as review the informed consent form. The study will directly compare success rates of medical providers for lumbar puncture using non-ultrasound technique vs. ultrasound guidance technique using simulation models. All interventions were performed on models. The models used were the 1) Lumbar Puncture/Epidural Trainer with Simulated IV Bag Model # LPE-10 (Simulab Corporation, Seattle, WA) and the 2) Geriatric Obese Lumbar Puncture/Epidural Trainer with Simulated IV Bag Model # LPGO-10 (Simulab Corporation, Seattle, WA) Participants were recruited at academic emergency medicine conferences. 15 participants were recruited. Subjects were requested to participate in study on a voluntary basis and all participants signed an informed consent form. Data were coded after collection to ensure privacy. There was no compensation for participants. The objectives were to:
- Determine the operator's preferred positioning of patient (mannequin).
- Determine the preferred position of the ultrasound machine relative to the operator's field of vision. 3) Compare standard LP technique vs. ultrasound guided on a standard LP model and an obese LP model, comparing time to success as well as number of attempts to success.
- Compare standard LP technique vs. ultrasound guided on a standard LP model and an obese LP model, comparing time to success as well as number of attempts to success, in reference to training level of participants.
The study assessed the ability of subjects' ability to perform a lumbar puncture with the standard technique vs. an ultrasound guided technique. A questionnaire asked the subjects their preferred position of ultrasound monitor in relation to model (left/right sided). The participants indicated their personal preference. Data was collected via numerical coding. The participants' academic training level was recorded but no further personal information was obtained other than the participant's name on consent form. The participants' personal preference for model/ultrasound positioning was recorded on individual questionnaire. Time to successful procedure and number of needle adjustments was recorded on a data collection form. Study included males and females, all greater than 18 years of age. All participants were emergency residents. Attending physician and students were excluded.
RESULTS
There were 15 participants in the study. The greatest proportion of participants was in the PGY-4 year of training. (40%) There were 6 participants (40%) in the “lower” years designation, (operationally defined as PGY 1,2) and 9 participants (60%) in the “lower” years designation (operationally defined as PGY 3,4,5). These two proportions are not statistically significant. (P-value = 0.26). 10 participants (66.6%) preferred the ultrasound machine to be on their right side (in right visual field). The other participants (5, 33.3%) preferred the left side (left visual field). This was statistically significant. (p = .05). 15 participants (100%) preferred the model to be in the upright position. This is highly statistically significant. (p = < 0.001). The majority of participants (66.6%) preferred that the ultrasound machine be located on their right side. This was statistically significant. (p = .05). The 15 participants performed an LP on the standard (nonobese) model without US guidance and with ultrasound guidance. The mean time for the standard model without ultrasound was 161 seconds (StDev 132.7 sec). The mean time for the standard model with ultrasound was 174.1 seconds (StDev 123.4 sec). Thus, the mean time for the standard model with ultrasound was greater than the mean time for the non-ultrasound approach. These mean times were not statistically significant. [Paired T test] (p = 0.779). The 15 participants performed an LP on the obese model without US guidance and with ultrasound guidance. The mean time for the obese model without ultrasound was 154 seconds (StDev 128 sec). The mean time for the obese model with ultrasound was 159 seconds (StDev 125.6 sec). These times were not statistically significant. (p = 0.81). The 15 participants performed an LP on the standard (nonobese) model without US guidance and with ultrasound guidance. The mean number of adjustments of the needle for the standard model without ultrasound was 13 (StDev 11.99). The mean number of adjustments for the standard model with ultrasound was 10.8 (StDev 10.26sec). The number of adjustments were not statistically significant. (p = 0.623). The 15 participants performed an LP on the standard (nonobese) model without US guidance and with ultrasound guidance. The mean number of adjustments of the needle for the obese model without ultrasound was 13.2 (StDev 12.14). The mean number of adjustments for the standard model with ultrasound was 12.73 (StDev 12.66). The number of adjustment results were not statistically significant. (p = 0.86). When timed performance was compared among the four measurements (standard model with and without ultrasound and the obese model, with and without ultrasound, it is noted that the mean time for both models is higher for the ultrasound group than for the non-ultrasound group. This is visually apparent with an interval plot of the 95% confidence intervals for the 4 measurements. All of the means are within the four confidence intervals. The differences were not statistically significant (Figure 1).
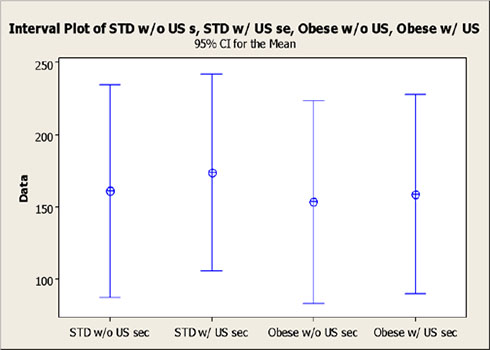
Figure 1: Summary graphic: Time metrics.
Time metric by model (standard vs. obese) and by adjunctive ultrasound (without or without). Means and 95% confidence intervals compared. When the number of adjustments needed performance was compared among the four measurements (standard model with and without ultrasound and the obese model, with and without ultrasound, it is noted that the mean number of adjustments for both models is lower for the ultrasound group than for the non-ultrasound group. This is visually apparent with an interval plot of the 95% confidence intervals for the 4 measurements. All of the means are within the four confidence intervals. The differences are not statistically significant (Figure 2).
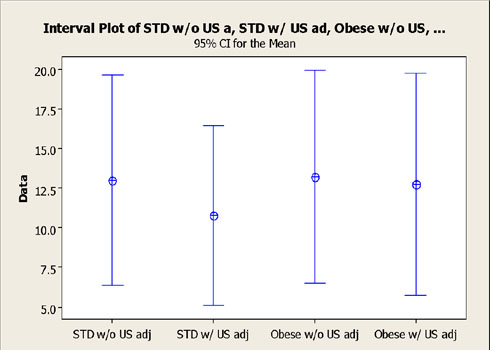
Figure 2: Summary graphic: (number of adjustments metric).
Time metric by model (standard vs. obese) and by adjunctive ultrasound (without or without). Means and 95% confidence intervals compared. The overall average time required without the use of ultrasound, average of standard and obese models, was 131.7 seconds (StDev 108) for upper PGY status (defined as PGY 3/4/5) vs. 195.8 seconds (StDev 119) for lower PGY status (defined as PGY 1/2). Thus upper level PGY status participants took less time and showed less variation than lower level PGY status participants when no ultrasound was used. The difference was not statistically significant. (P-Value = 0.314). The overall average time required with the use of ultrasound, average of standard and obese models, was 120.2 seconds (StDev 91.3 ) for upper PGY status (defined as PGY 3/4/5) vs. 236.2 seconds (StDev 103.5) for lower PGY status (defined as PGY 1/2). Thus upper level PGY status participants took less time and showed less variation than lower level PGY status participants when ultrasound was used. The difference was statistically significant. (P-Value = 0.05) (Figure 3).
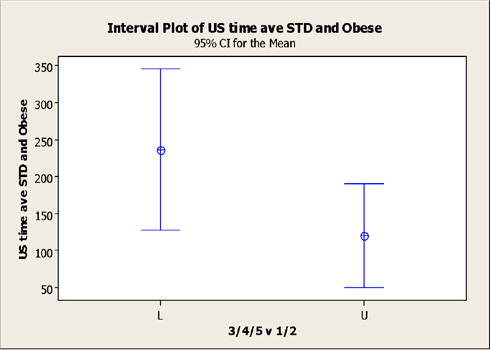
Figure 3: Analysis of factor of PGY status: ultrasound used.
The overall average adjustments required without the use of ultrasound, average of standard and obese models, was 10.8 (StDev 9) for upper PGY status (defined as PGY 3/4/5) vs. 16 (StDev 12) for lower PGY status (defined as PGY 1/2). Thus upper level PGY status participants made fewer adjustments and showed less variation in adjustments than lower level PGY status participants when no ultrasound was used. The difference was not statistically significant. (P-Value = 0.33) (Figure 4).
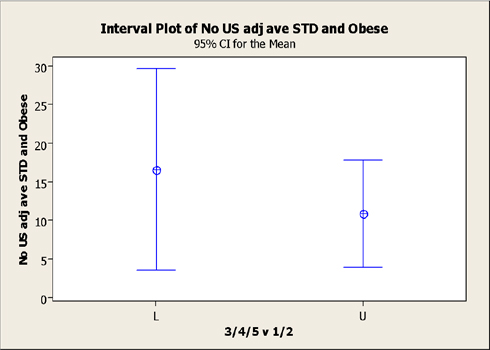
Figure 4: Analysis by factor of PGY status: Average adjustments, No ultrasound used, both models.
The overall average adjustments required with the use of ultrasound, average of standard and obese models, was 8 (StDev 108) for upper PGY status (defined as PGY 3/4/5) vs. 16 (StDev 119) for lower PGY status (defined as PGY 1/2). Thus upper level PGY status participants made fewer adjustments and showed less variation in number adjustments than did lower level PGY status participants when ultrasound was used. The difference was not statistically significant. (P-Value = 0.737) (Figure 5).
The boxplots and frequency histograms of the pre-test and post-test groups visually display the differences between the distributions of the pre-test and post-test results. (Figure 1, Figure 2). Of the 30 participants, 5 required additional testing. (5/30=16.6%) All 5 (100%) reached the 5/6 correct response endpoint on the first additional testing cycle. The mean test score for this cohort was 93.3% on the retest.[Range=83.3%, SEM=.04 (4%), SD=.09%)The training level of the five was essentially evenly distributed among the first four years of training. There were two PGY-3 residents who required retesting. There were no PGY-5 residents who required retesting.
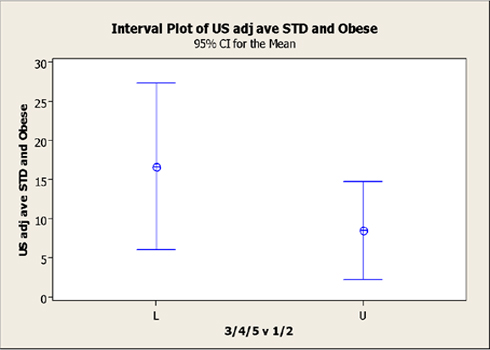
Figure 5: Analysis by factor of PGY status: Average adjustments, ultrasound used, both models.
Average time: Visual summary: comparison upper and lower PGY performance, both models (standard and obese) average time:It is visually apparent, that in reference to time performance, the mean time shown by the upper PGY (3,4,5) was lower for all four combinations of two models (standard and obese)by the two methods (no ultrasound v ultrasound). The mean performance, upper PGY v lower PGY, for the obese model with the use of ultrasound, was statistically significant. (P-Value = 0.047) (Figure 6).
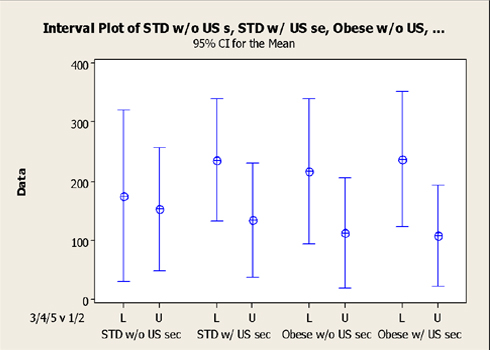
Figure 6:Average time: Visual summary: comparison upper and lower PGY performance, both models (standard and obese) average time.
The mean number of adjustments shown by the upper PGY (3,4,5) was lower for all four combinations of two models (standard and obese) by the two methods (no ultrasound v ultrasound). The mean performance, upper PGY v lower PGY, for the obese model with the use of ultrasound, appears to be close to the lower limit of the 95% CI, but it was NOT statistically significant. (P-Value = 0.07).
DISCUSSION
There were 15 participants in the study. A “lower” designation of training was operationally defined as PGY 1,2. An “upper” designation was operationally defined as PGY 3,4,5. This stratification step was performed in order to assess for a possible training effect. There were 6 participants (40%) in the “lower” designation of training and 9 participants (60%) in the “upper” designation these two proportions were not statistically significant. (P-value = 0.26). The majority of participants (66.6%) preferred that the ultrasound machine be located on their right side. This was statistically significant. (p = .05). The mean times and the number of needle adjustments for the standard (non-obese) model, with and without ultrasound, were not statistically significant. The mean times and the number of needle adjustments for the obese model, with and without ultrasound, were also not statistically significant. It was initially hypothesized that the utility of ultrasound guided lumbar puncture would be greatest the geriatric obese model however there was statistically no difference when lumbar puncture was completed with standard technique or with ultrasound. When the data was analyzed by PGY status, upper level PGY status participants (defined as PGY 3/4/5) took less time and showed less variation than lower level PGY status participants (defined as PGY 1/2) when no ultrasound was used. The difference was not statistically significant. Upper level PGY status participants made fewer adjustments and showed less variation in adjustments than lower level PGY status participants when no ultrasound was used. The difference was not statistically significant. When ultrasound was used, upper level PGY status participants took less time and showed less variation than lower level PGY status participants. The difference was statistically significant. (P-Value = 0.05) Upper level PGY status participants made fewer adjustments and showed less variation in number adjustments than did lower level PGY status participants when ultrasound was used. However, the difference was not statistically significant. In reference to time performance, the mean time shown by the upper PGY (3,4,5) was lower for all four combinations of two models (standard and obese) by the two methods (no ultrasound v ultrasound). The mean time performance for the obese model with the use of ultrasound was less for upper PGY status participants than for lower. This difference was statistically significant. (P-Value = 0.047) In reference to the number of adjustments, the mean number of adjustments shown by the upper PGY (3,4,5) was lower for all four combinations of two models (standard and obese) by the two methods (no ultrasound v ultrasound), however, this difference was not statistically significant. The data suggests that the use of ultrasound to perform lumbar puncture on simulated model had no statistically significant difference. Statistically significant differences were noted when comparing lower PGY level residents with higher PGY level residents, which suggests that the practitioners overall training has more influence on time to success and repositions than does the adjunct use of ultrasound. The study was limited by a relatively small sample size. The study was also limited by an inability to control for familiarity with the use of ultrasound. Each participant had varying degrees of training with ultrasound.
CONCLUSION
The majority of participants (66.6%) preferred that the ultrasound machine be located on their right side. This was statistically significant. (p = .05). The mean times and the number of needle adjustments for the standard (non-obese) model, with and without ultrasound, were not statistically significant. The mean times and the number of needle adjustments for the obese model, with and without ultrasound, were also not statistically significant. There was an interesting association with training level. When the data was analyzed by PGY status, upper level PGY status participants (defined as PGY 3/4/5) took less time and showed less variation than lower level PGY status participants (defined as PGY 1/2) when no ultrasound was used. The difference was not statistically significant. Upper level PGY status participants made fewer adjustments and showed less variation in adjustments than lower level PGY status participants when no ultrasound was used. The difference was not statistically significant. In reference to time performance, the mean time shown by the upper PGY (3,4,5) was lower for all four combinations of two models (standard and obese) by the two methods (no ultrasound v ultrasound). The mean time performance for the obese model with the use of ultrasound was less for upper PGY status participants than for lower. This difference was statistically significant. (P-Value = 0.047) When teaching the procedure of ultrasound guided lumbar puncture our study shows a statistically significant difference in an upright model with the ultrasound machine located to the right. This suggests that this a reasonable setup to help facilitate the practitioners comfort and learning. There is no statistical difference to suggest that the blind (non-ultrasound-supported) technique is faster or requires less repositions than ultrasound guided. Future studies may show a difference in lumbar puncture with ultrasound on simulated models with appropriate instruction and training sessions in the technique. It is possible that with several training sessions the use of ultrasound may be a useful adjunct.
REFERENCES
- Ferre RM and Sweeney TW. (2007). Emergency physicians can easily obtain ultrasound images of anatomical landmarks relevant to lumbar puncture. Am J Emerg Med. 25(3), 291- 296.
- Stiffler KA, Jwayyed S, Wilber ST and Robinson A. (2007). The use of ultrasound to identify pertinent landmarks for lumbar puncture. Am J Emerg Med. 25(3), 331-334.
- Swaminathan A and Hom J. (2014). Does Ultrasonographic Imaging Reduce the Risk of Failed Lumbar Puncture? Annals of emergency medicine. 63(1), 33-34.
- Chin KJ, Perlas A, Singh M, Arzola C, et al. (2009). An ultrasound- assisted approach facilitates spinal anesthesia for total joint arthroplasty. Can J Anaesth. 56(9), 643-650.